Original Link: https://www.anandtech.com/show/7583/adata-xpg-v2-review-2x8-gb-at-ddr32800-121414-165-v
ADATA XPG V2 Review: 2x8 GB at DDR3-2800 12-14-14 1.65 V
by Ian Cutress on December 17, 2013 12:00 PM EST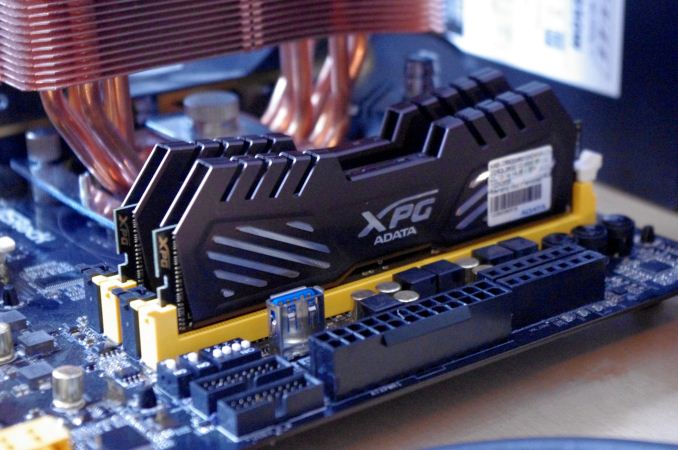
The final kit in our current run of DDR3 on Intel reviews falls at the feet of a kit that blends a high rated speed with density. When it comes to high MHz numbers, we typically see 4 GB modules as the standard, due to a higher density kit being more difficult to push in frequency. ADATA sampled us two of their DDR3-2800 C12 kits in 2x8 GB form, representing perhaps one of the final hurdles before DDR4 reaches the market, as long as your wallets are deep enough.
ADATA XPG V2: 2x8 GB at DDR3-2800 C12 1.65V Overview
I like to tell the situation how it is. Fast memory is always a thorny issue when it comes to reviewers, due to the propensity to give awards out like candy when in fact there is little to no performance gain – it all becomes about ego with regards owning the kit. For this reason, we tested a high end memory kit earlier this year in over 25 different configurations through 1333 MHz C9 to 3000 MHz C12 to find out where the law of limiting returns applies. The result of that was that 1866 C9 / 2133 C10 was the sweet spot, and anything over this had minute returns for most of our real world testing (we accepted that there are specific compute scenarios that do continually get a benefit).
So this means that the ADATA XPG V2 DDR3-2800 C12 kit we have in to review already starts off as a quest to brag about high performance memory. Using Hynix CFR ICs to push for frequency, ADATA took a slightly different route to most and decided on 8 GB modules rather than the standard 4 GB ones we see on the market. This means a match between high specification and high density memory: normally a very good thing in terms of developing an ecosystem, but only as far as the wallet can afford it.
The biggest drawback ADATA have with this memory kit is the price. When I started testing for this review, the AX3U2800W8G12-DMV kit was $600 – this has since risen to $646 due to the increase in memory pricing. That is a lot of money, no matter which way you cut it (it falls in the middle of two other kits of similar specifications): for similar pricing you could big up a 8x8GB kit of 2133 C9 of an X79 platform or save $100 and get 4x8GB of 2666 C11 for Z87. Pricing at the high end is monumentally crazy for what are specifications improvements rather than real world improvements. The only reason these kits cost so much is that the memory manufacturers bid on batches of CFR ICs, and the man hours required to test them – if only one memory stick in 1000 hits the required timings and voltages, that labor has to be paid for at some level.
Ultimately this is a 2x8GB kit with a Performance Index out of the box of 233, which was capable of ~240 when overclocked. Being 2800 C12, the kit does not fall into any of our benchmark pits that the low end kits fall into, but in the same breath it provides no direct advantage over any 2400 C10 kit which is substantially cheaper.
An unnamed source discussed with me this week the need for memory manufacturers to produce these high end kits, regardless of actual quantities sold, merely due to the fact that ‘everyone is doing it’ and a high MHz kit offers something in terms of marketing. But the result still stands: 2800 C12 (and up) does not benefit end users without a specific requirement for memory speed – I would perhaps even throw in 2666 to that mix as well. This may very well change with new games like BF4 (to be part of our 2014 testing), but at this point in our testing it makes little sense to look at high end kits other than excess cash burning a hole in your bank account.
Specifications
| ADATA | Corsair | Patriot | ADATA | G.Skill | ||
| Speed | 1600 | 2400 | 2400 | 2400 | 2800 | 3000 |
| ST | 9-11-9-27 | 11-13-13-35 | 10-12-12-31 | 10-12-12-31 | 12-14-14-36 | 12-14-14-35 |
| Price | £125 | $200 | - | $92 | $650 | $520 |
| XMP | Yes | Yes | Yes | Yes | Yes | Yes |
| Size | 2 x 8GB | 2 x 8GB | 2 x 8GB | 2 x 4GB | 2 x 8GB | 2 x 4GB |
|
Performance Index |
178 | 218 | 240 | 240 | 233 | 250 |
|
|
||||||
| MHz | 1600 | 2400 | 2400 | 2400 | 2800 | 3000 |
| Voltage | 1.35 V | 1.65 V | 1.65 V | 1.65 V | 1.65 V | 1.65 V |
| tCL | 9 | 11 | 10 | 10 | 12 | 12 |
| tRD | 11 | 13 | 13 | 12 | 14 | 14 |
| tRP | 9 | 13 | 13 | 12 | 14 | 14 |
| tRAS | 27 | 35 | 31 | 31 | 36 | 31 |
| tRC | 38 | 46 | 61 | 43 | 50 | 49 |
| tWR | 12 | 20 | 20 | 16 | 16 | 16 |
| tRRD | 280 | 315 | 315 | 301 | 367 | 391 |
| tRFC | 5 | 6 | 10 | 7 | 7 | 7 |
| tWTR | 6 | 10 | 10 | 10 | 11 | 12 |
| tRTP | 6 | 10 | 10 | 10 | 11 | 12 |
| tFAW | 24 | 33 | 46 | 26 | 27 | 29 |
| CR | - | 2 | 2 | 3 | 2 | 2 |
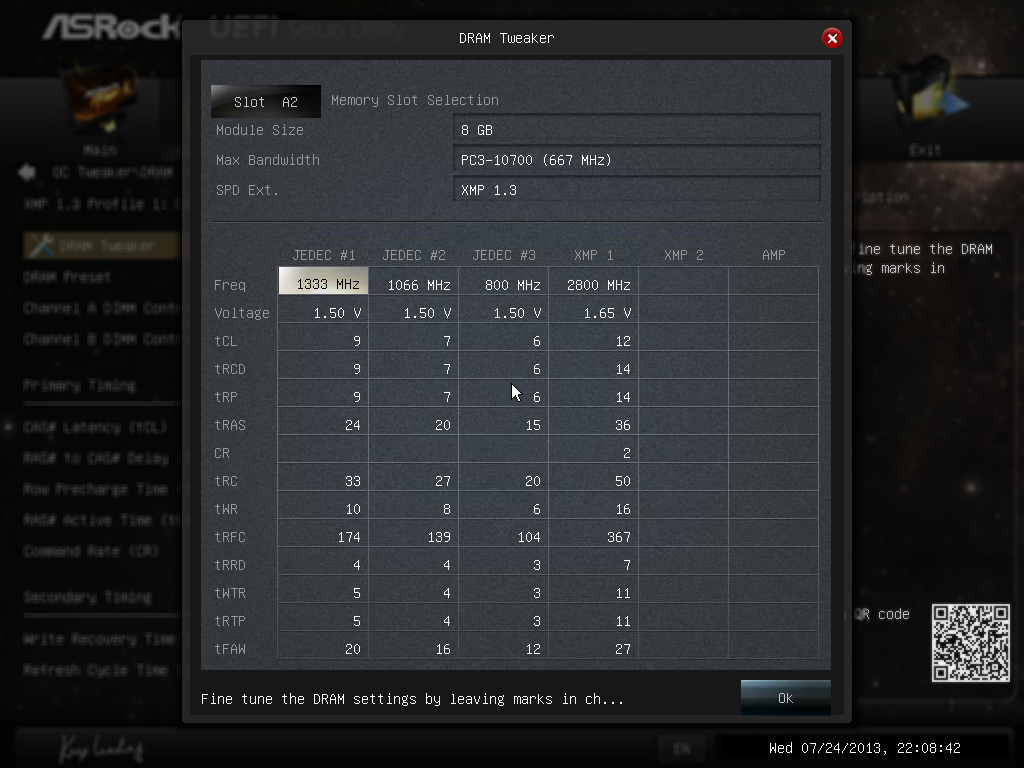
When using higher density memory, it is expected that some sub-timings will be slackened to ensure proper performance – ultimately the nearest kit we can compare it to is the 2400 C10 from Corsair, which had loose tRC and tRFC timings to begin with, which the ADATA beats despite being higher in MHz. Overall the ADATA 2800 C12 numbers are in line with what we expect.
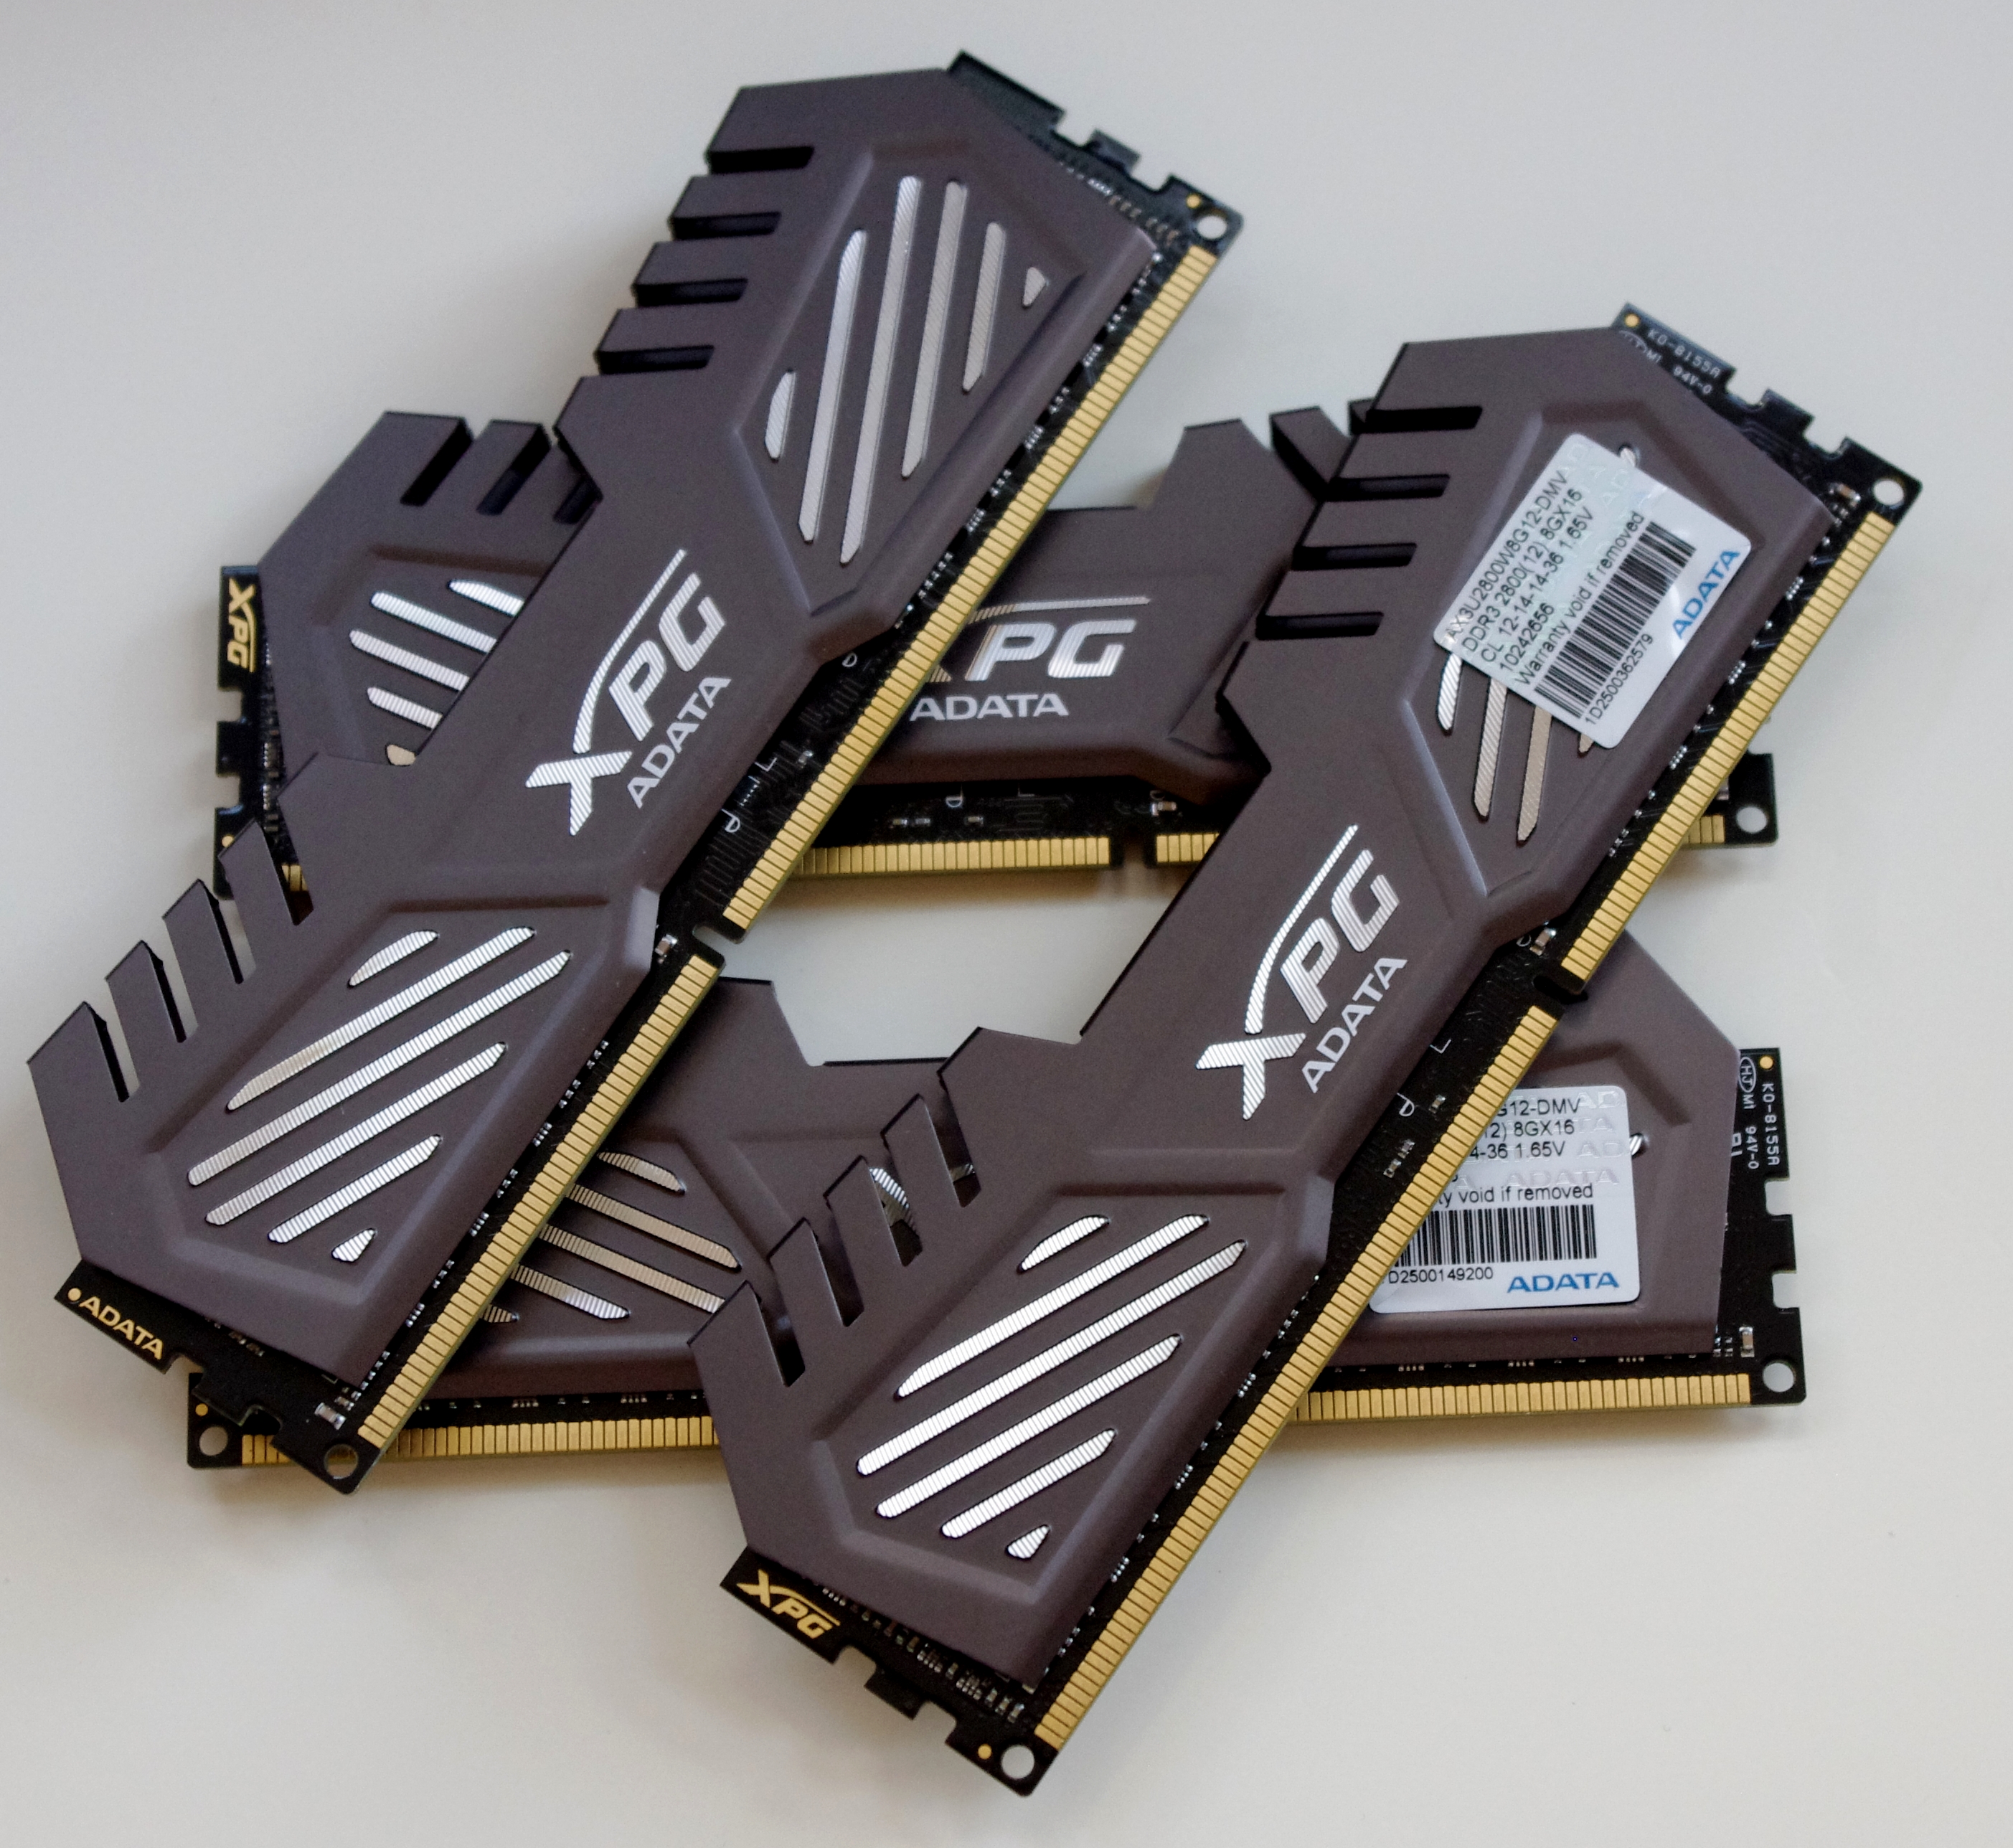
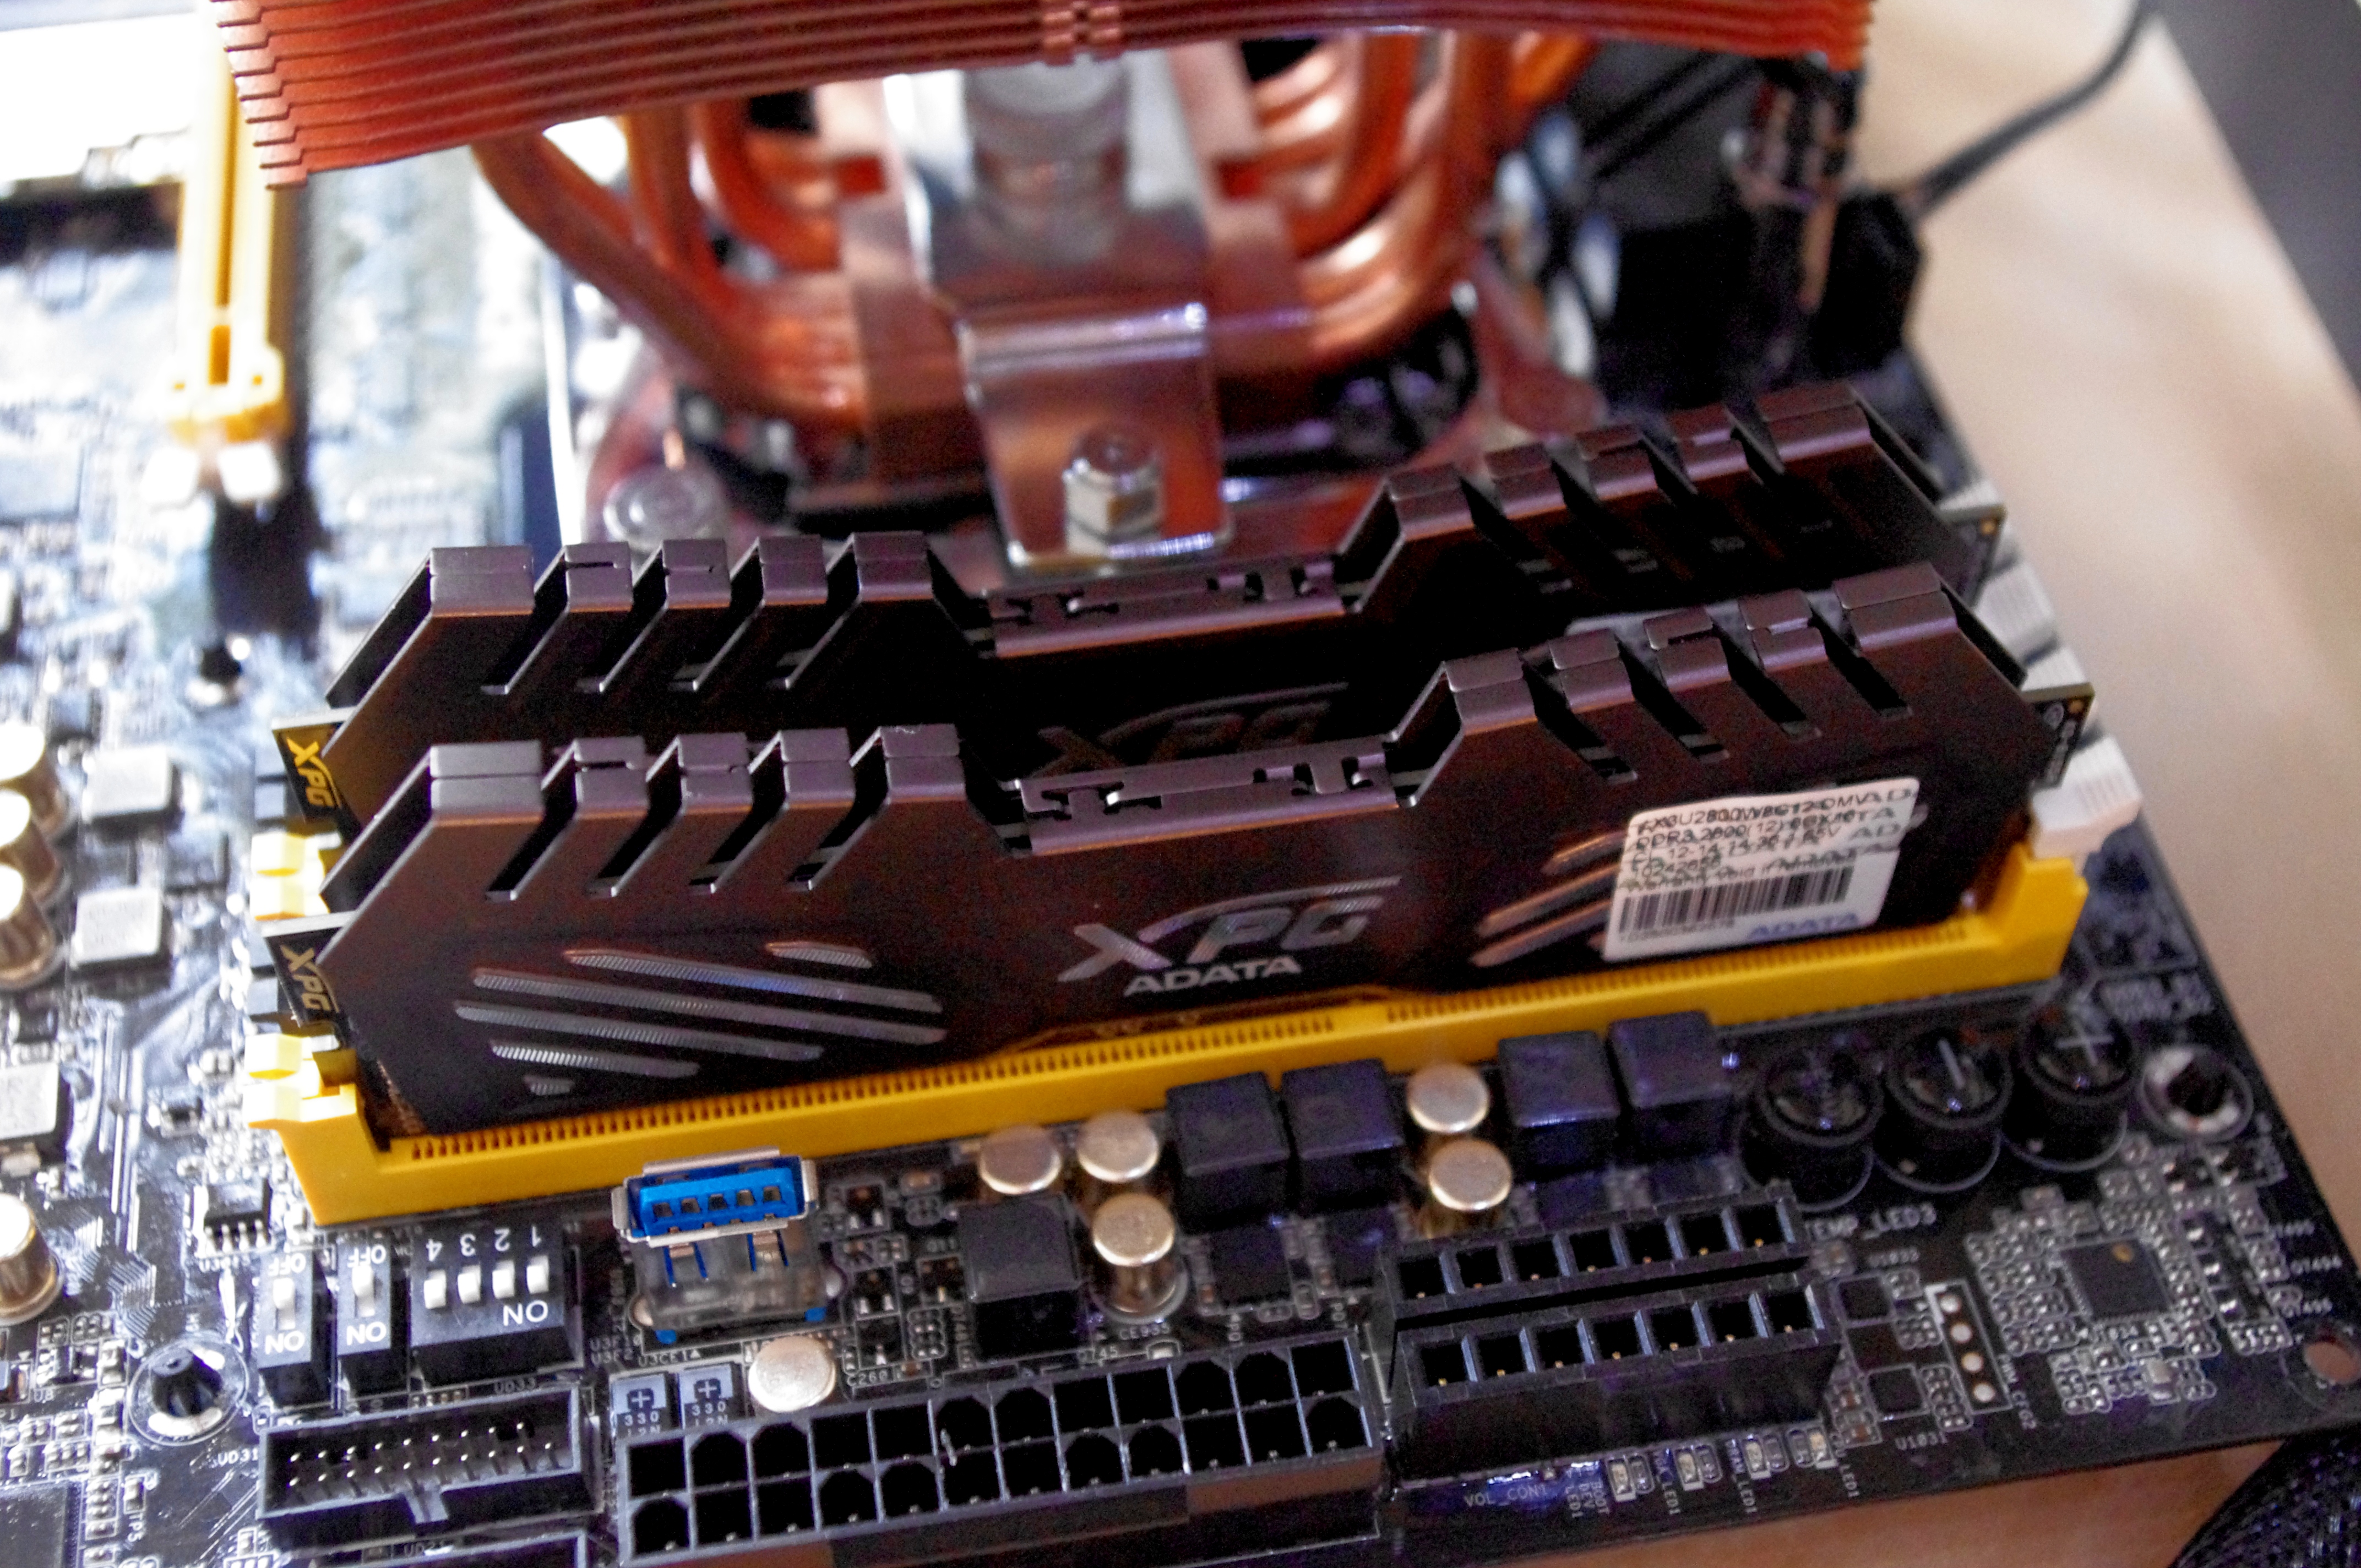
Visual Inspection
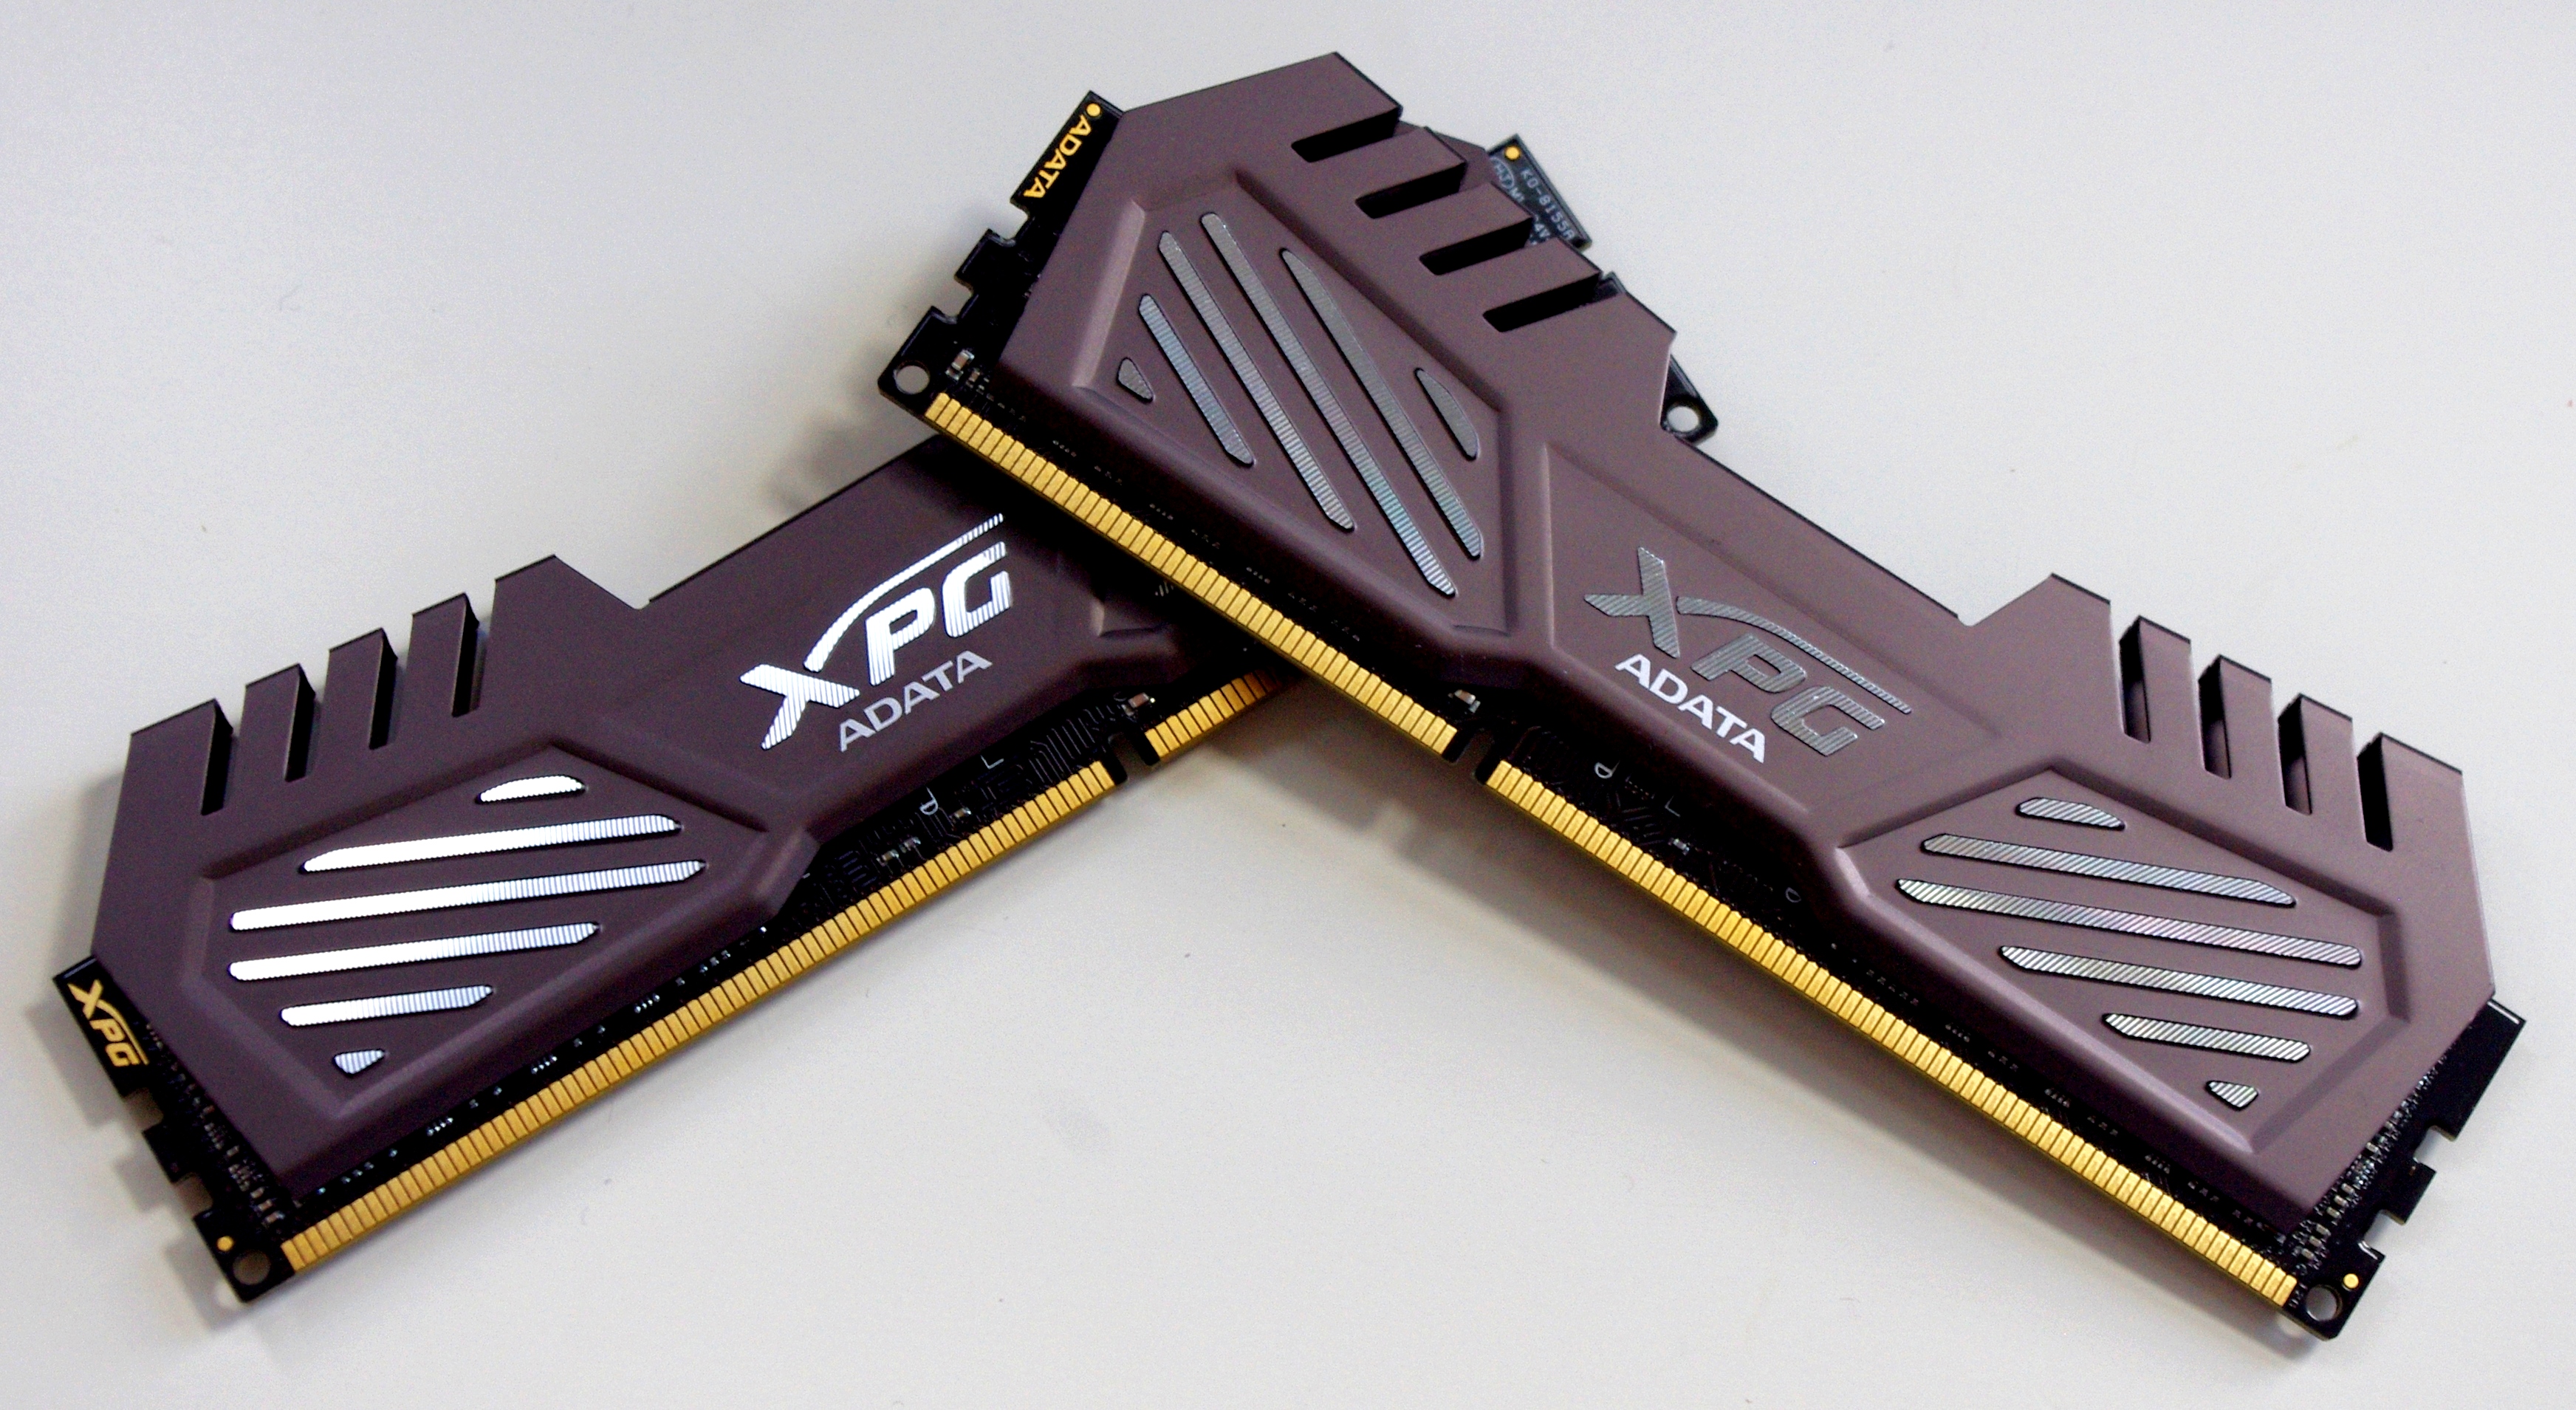
Like the other ADATA memory reviews we have done over the past few months, the 2800 C12 $650 kit comes the same way as the rest – a simple plastic clamshell for easy removal. The memory kit itself is a Tungsten Silver/Grey, compared to the Gold styling we have seen previously.
The styling is exactly the same as the ADATA 2400 C11 kit we reviewed, giving an extra 13.8mm in z-height for a total height of 44mm.
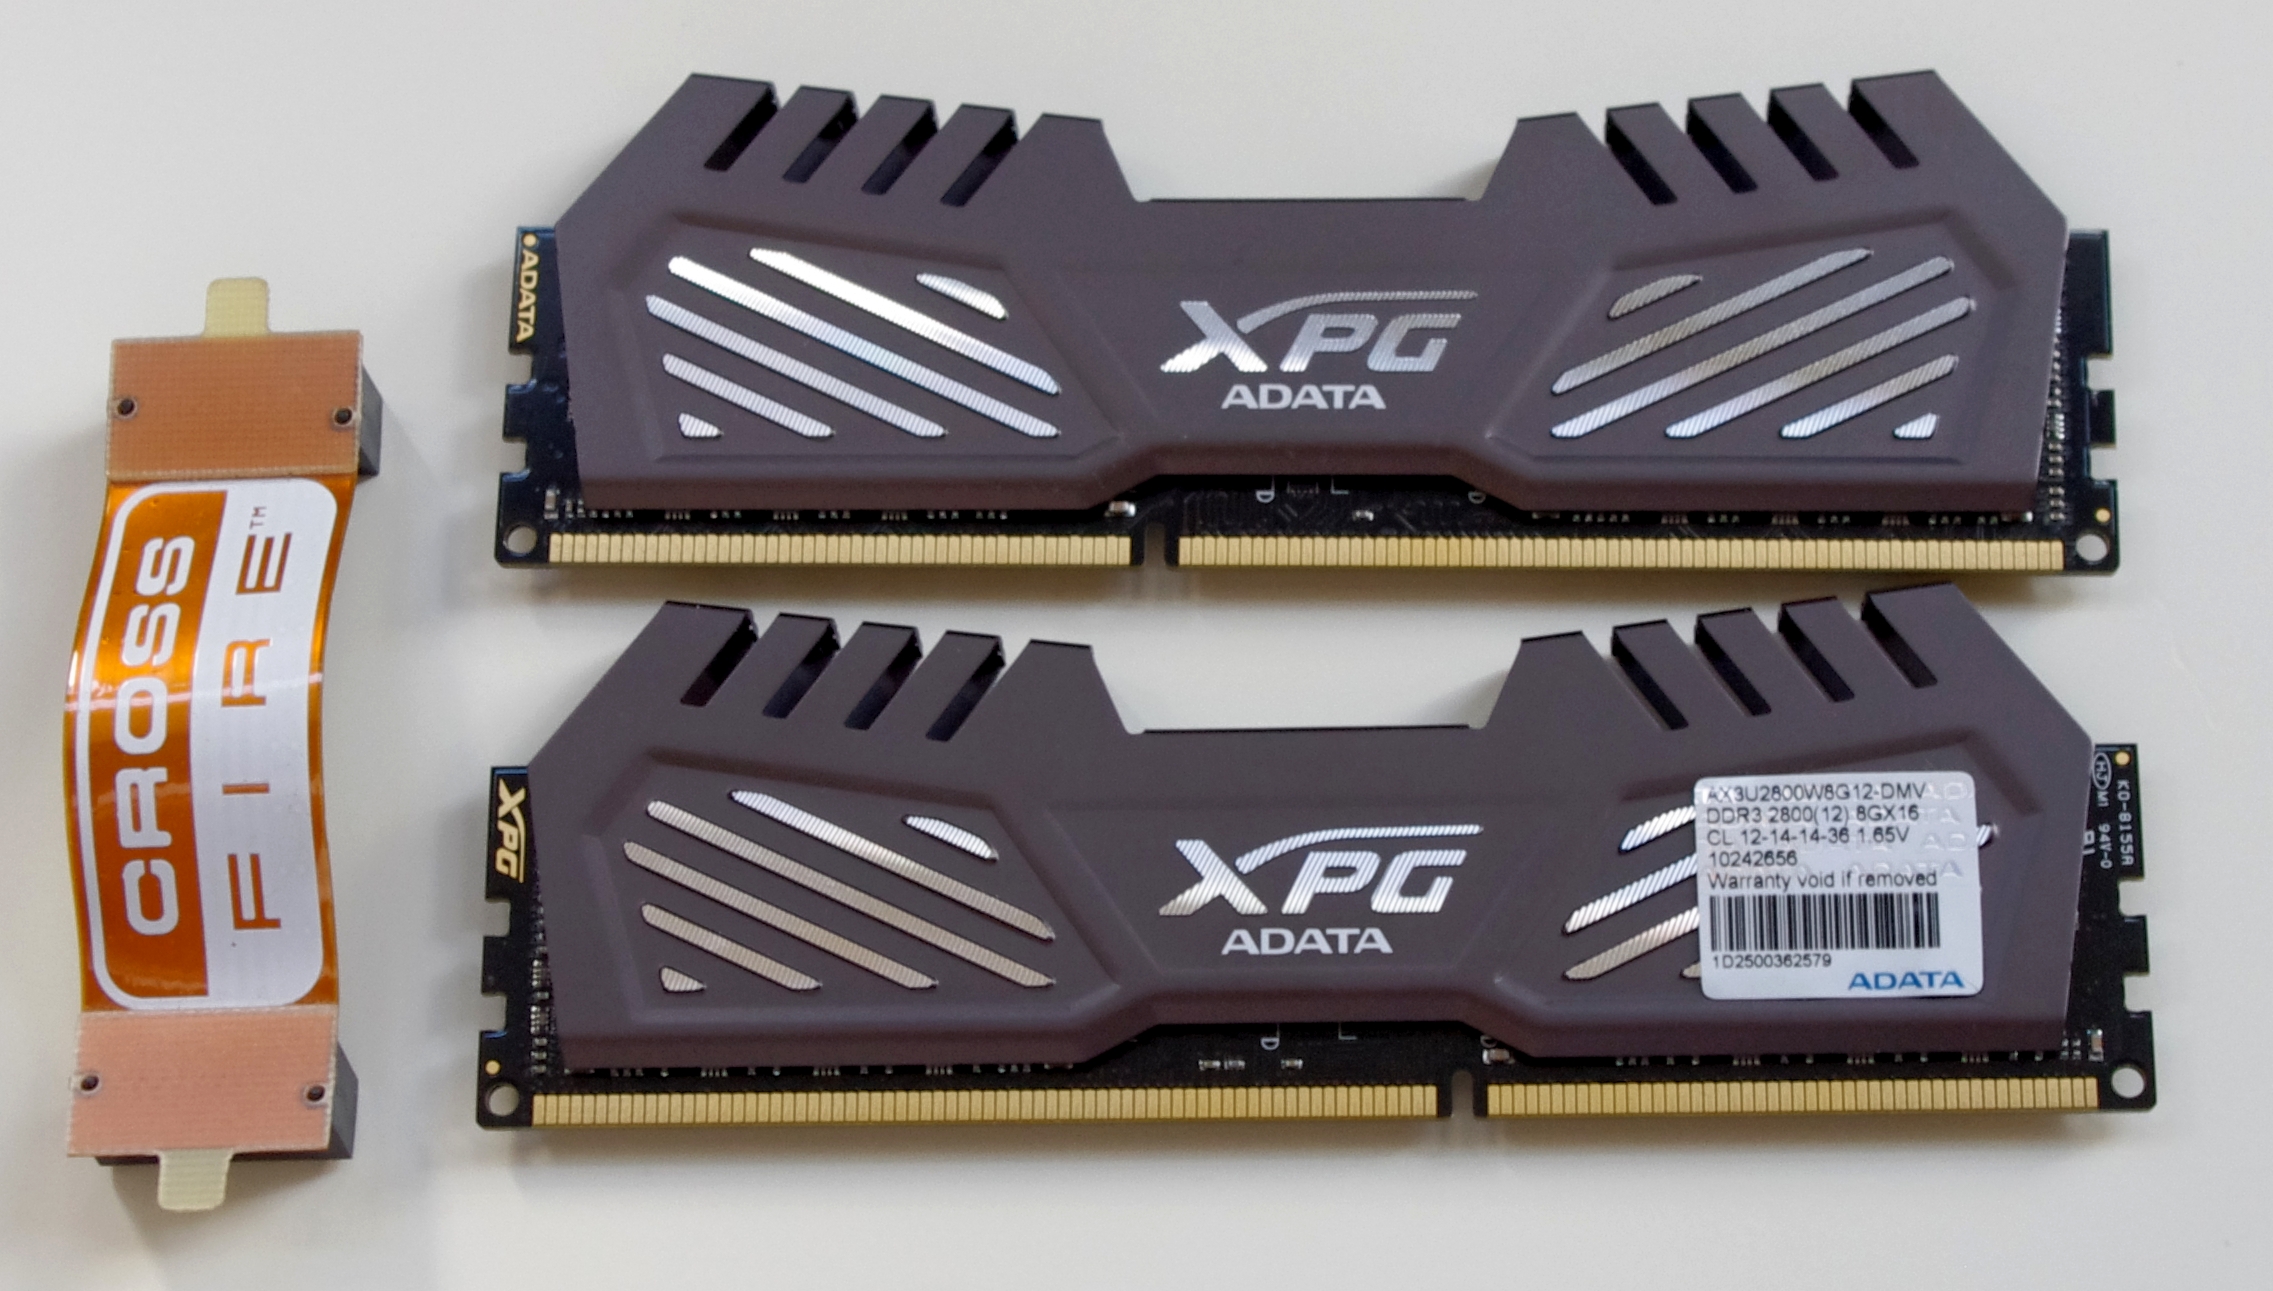
ADATA gave us two kits to review, in a 2x8 GB and 4x8 GB configuration. It is worth noting that memory kits are never guaranteed to work together – they often need overclocking headroom or the CPU IMC needs to be able to cope with them. There are plenty of issues that can arise when memory kits do not work together, and the only way to ensure that four sticks of this memory run at the rated speed is to buy a four module kit.


Market Positioning
Being at the top end of the spectrum, a 2x8 GB 2800 MHz C12 memory kit actually does not have a lot of competition. For the round sum of $646 however, the ADATA kit (as well as the others) have a hard time being taken seriously when cheaper kits offer similar performance. Here is a rundown of 2x8 GB 2666MHz+ kits and pricing as of 12/12:
$205: G.Skill TridentX 2x8 GB 2666 C12
$230: Team Xtreem 2x8 GB 2666 C11
$270: G.Skill TridentX 2x8GB 2666 C11
$320: Corsair Dominator Platinum 2x8GB 2666 C11
$320: Corsair Dominator Platinum 2x8GB 2666 C12
$600: G.Skill TridentX 2x8GB 2800 C12
$646: ADATA XPG V2 2x8GB 2800 C12
$730: Corsair Vengeance Pro 2x8GB 2800 C12
$750: G.Skill TridentX 2x8GB 2933 C12
If we move to the 4x4 GB kits:
$211: Avexir Core ASUS Gold 4x4 GB 2666 C11 1.5V
$211: Avexir Core MSI Gaming 4x4 GB 2666 C11
$260: Mushkin Enhanced Stealth 4x4GB 2666 C12
$270: Mushkin Enhanced Blackline 4x4GB 2666 C12
$270: Mushkin Enhanced Blackline Radioactive 4x4GB 2666 C12
$290: G.Skill RipjawsZ 4x4GB 2666 C11
$300: Avexir Core MSI OC 4x4GB 2666 C11
$300: G.Skill TridentX 4x4GB 2666 C11
$500: Mushkin Enhanced Stealth 4x4GB 2800 C12
$530: Mushkin Enhanced Stealth Red 4x4GB 2800 C12
$540: Avexir Core Blue 4x4GB 2800 C12
$580: G.Skill TridentX 4x4GB 2800 C11
$646: ADATA XPG V2 2x8GB 2800 C12
$720: G.Skill TridentX 4x4GB 2933 C12
$735: Corsair Vengeance Pro 4x4GB 2933 C12
$740: G.Skill RipjawsZ 4x4GB 2933 C12
$1400: G.Skill TridentX 4x4GB 3000 C12
It becomes painfully obvious that there is a significant price barrier between 2666 MHz and 2800 MHz memory kits: the most expensive 2666 kit is $320, and the cheapest 2800 kit is $500. That becomes a bitter pill to spend at least $180 for the privilege in a 16GB kit.
A ceiling of ~$650 on memory also offers up these opportunities:
$650: G.Skill RipjawsZ 8x8GB 2133 C11
$650: G.Skill RipjawsZ 8x8GB 1866 C10
$620: Corsair XMS 8x8GB 1333 C9
$610: Corsair XMS 8x8GB 1600 C11
$600: G.Skill RipjawsZ 8x8GB 1600 C10
$600: Corsair Vengeance Pro 4x8GB 2666 C11
$560: Corsair Dominator Platinum 4x8GB 2400 C10
$550: G.Skill TridentX 4x8GB 2666 C11
$550: G.Skill TridentX 2x4GB 3000 C12
$520: Avexir Core 2x4GB 3000 C12
So, 2x8 GB 2800 C12 or 4x8GB of 2666 C11, for the same price or cheaper? This pricing is not endemic by factor of ADATA, it is prevalent throughout memory vendors and thus is leads to the obvious conclusion in the absence of super awesome benchmark results.
Test Bed
| Processor |
Intel Core i7-4770K Retail @ 4.0 GHz 4 Cores, 8 Threads, 3.5 GHz (3.9 GHz Turbo) |
| Motherboards | ASRock Z87 OC Formula/AC |
| Cooling |
Corsair H80i Thermalright TRUE Copper |
| Power Supply | Corsair AX1200i Platinum PSU |
| Memory |
ADATA XPG V2 DDR3-2400 C11-13-13 1.65V 2x8 GB Patriot Viper III DDR3-2400 C10-12-12 1.65V 2x4 GB ADATA XPG V1.0 DDR3L-1600 C9-11-9 1.35V 2x8 GB Corsair Vengeance Pro DDR3-2400 C10-12-12 1.65V 2x8 GB ADATA XPG V2 DDR3-2800 C12-14-14 1.65V 2x8 GB |
| Memory Settings | XMP |
| Discrete Video Cards |
AMD HD5970 AMD HD5870 |
| Video Drivers | Catalyst 13.6 |
| Hard Drive | OCZ Vertex 3 256GB |
| Optical Drive | LG GH22NS50 |
| Case | Open Test Bed |
| Operating System | Windows 7 64-bit |
| USB 3 Testing | OCZ Vertex 3 240GB with SATA->USB Adaptor |
Many thanks to...
We must thank the following companies for kindly donating hardware for our test bed:
Thank you to OCZ for providing us with 1250W Gold Power Supplies.
Thank you to Corsair for providing us with an AX1200i PSU, and Corsair H80i CLC
Thank you to ASUS for providing us with the AMD GPUs and some IO Testing kit.
Thank you to ECS for providing us with the NVIDIA GPUs.
Thank you to Rosewill for providing us with the 500W Platinum Power Supply for mITX testing, BlackHawk Ultra, and 1600W Hercules PSU for extreme dual CPU + quad GPU testing, and RK-9100 keyboards.
Thank you to ASRock for providing us with the 802.11ac wireless router for testing.
‘Performance Index’
In our Haswell memory overview, I introduced a new concept of ‘Performance Index’ as a quick way to determine where a kit of various speed and command rate would sit relative to others where it may not be so obvious. As a general interpretation of performance in that review, the performance index (PI) worked well, showing that memory kits with a higher PI performed better than those that a lower PI. There were a few circumstances where performance was MHz or CL dominated, but the PI held strong for kit comparisons.
The PI calculation and ‘rules’ are fairly simple:
- Performance Index = MHz divided by CL
- Assuming the same kit size and installation location are the same, the memory kit with the higher PI will be faster
- Memory kits similar in PI should be ranked by MHz
- Any kit 1600 MHz or less is usually bad news.
That final point comes about due to the law of diminishing returns – in several benchmarks in our Haswell memory overview performed very poorly (20% worse or more) with the low end MHz kits. In that overview, we suggested that an 1866 C9 or 2133 C10 might be the minimum suggestion; whereas 2400 C10 covers the sweet spot should any situation demand good memory.
With this being said, the results for our kits are as follows:
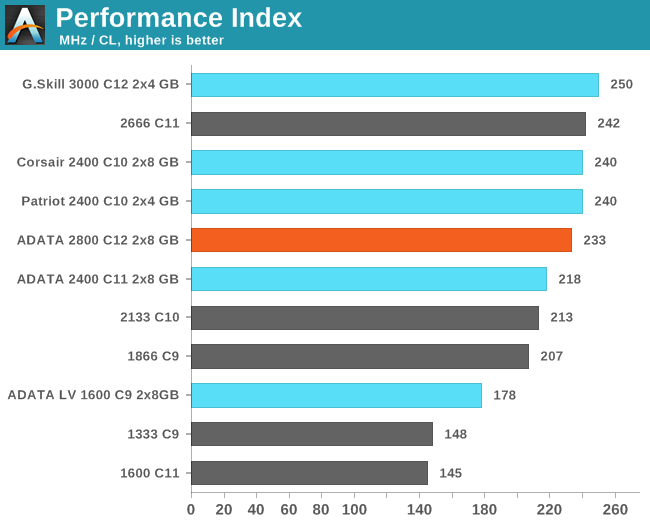
The 2800 C12 kit starts high up our table, but not the best Performance Index. Given the recommendation list above, 233 is close enough to 240 to be comparable.
IGP Gaming
The activity cited most often for improved memory speeds is IGP gaming, and as shown in both of our tests of Crystalwell (4950HQ in CRB, 4750HQ in Clevo W740SU), Intel’s version of Haswell with the 128MB of L4 cache, having big and fast memory seems to help in almost all scenarios, especially when there is access to more and more compute units. In order to pinpoint where exactly the memory helps, we are reporting both average and minimum frame rates from the benchmarks, using the latest Intel drivers available. All benchmarks are also run at 1360x768 due to monitor limitations (and produces more relevant frame rate numbers).
Bioshock Infinite:
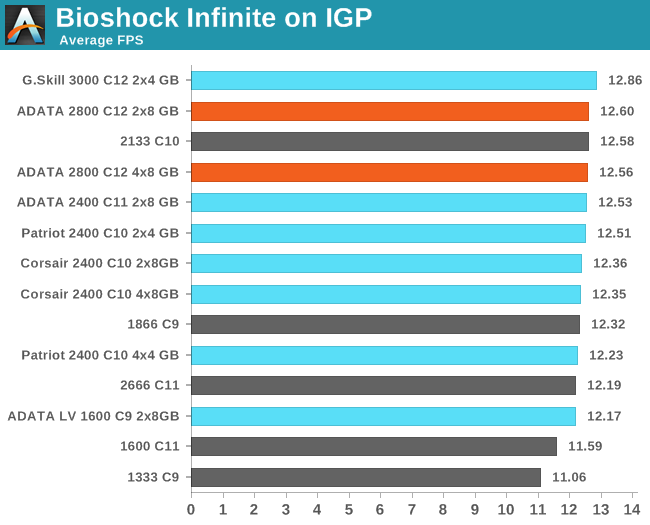
As expected, a 2800 C12 kit should come near the top for FPS numbers - Bioshock is a little odd in its minimum FPS numbers however, showing a middle of the road result for this kit.
Tomb Raider:
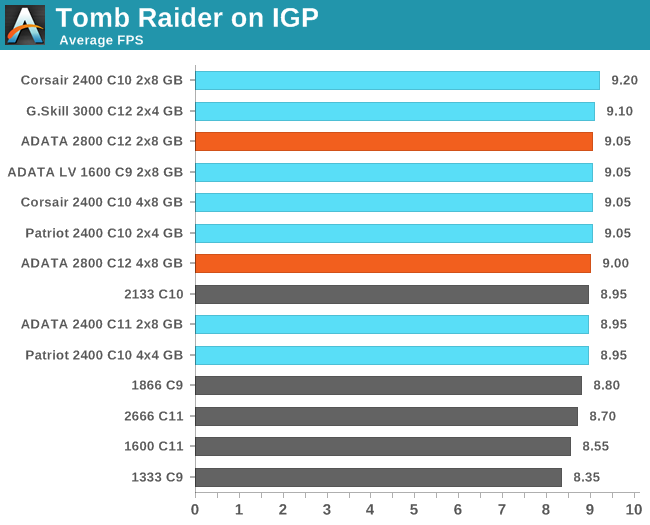
Again this kit hits the higher echelons of Tomb Raider frame rates.
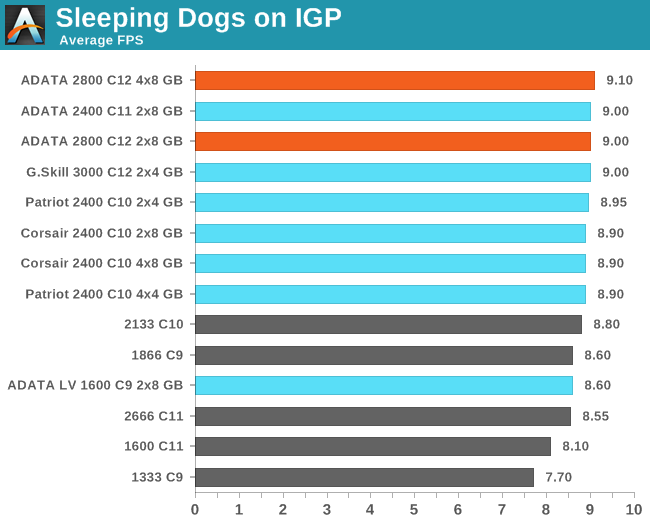
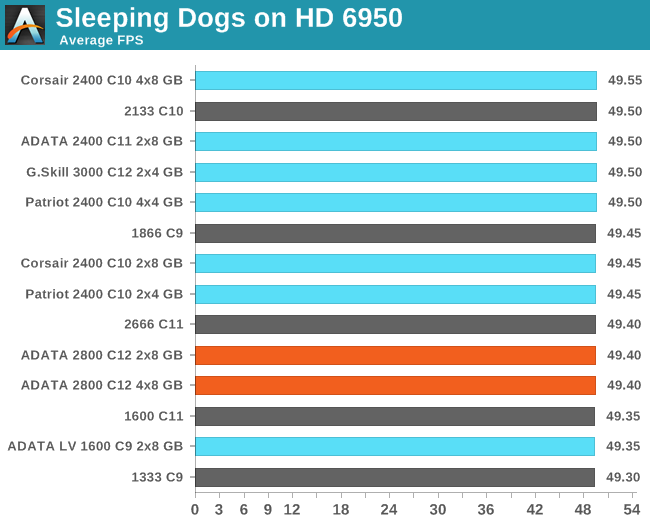
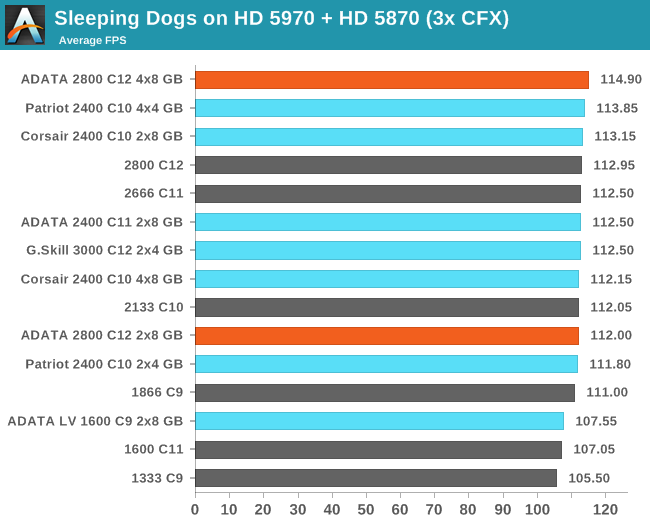
Sleeping Dogs:
Single dGPU Gaming
For our single discrete GPU testing, rather than the 7970s which normally adorn my test beds (and were being used for other testing), I plumped for one of the HD 6950 cards I have. This ASUS DirectCU II card I purchased pre-flashed to 6970 specifications, giving a little more oomph. Typically discrete GPU options are not often cited as growth areas of memory testing, however we will let the results speak for themselves.
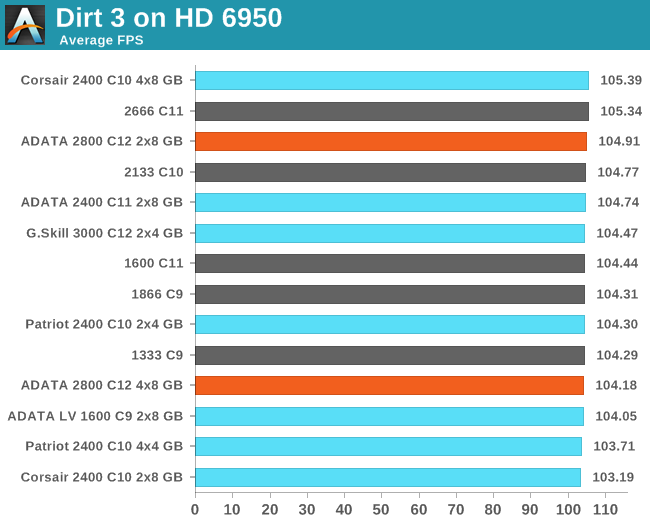
Dirt 3:
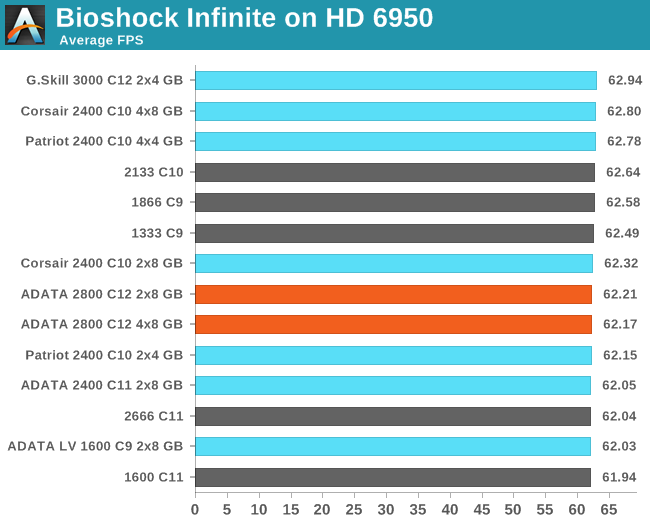
Bioshock Infinite:
Tomb Raider:
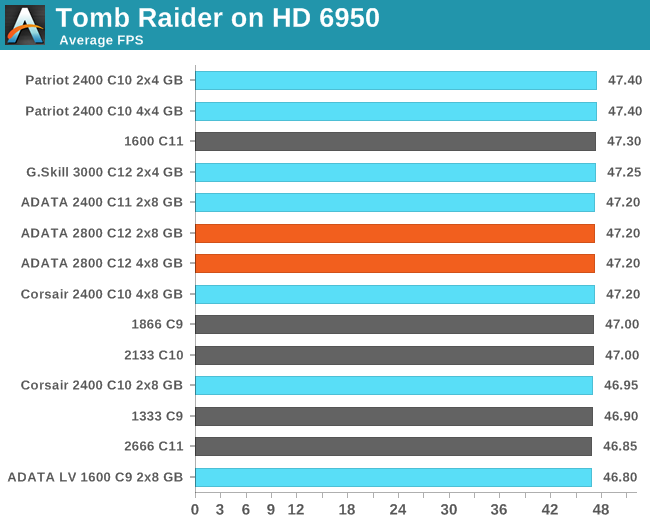
For some reason we see a small dive in terms of Tomb Raider minimum FPS numbers.
Sleeping Dogs:
Tri-GPU CrossFireX Gaming
Our final set of GPU tests are a little more on the esoteric side, using a tri-GPU setup with a HD5970 (dual GPU) and a HD5870 in tandem. While these cards are not necessarily the newest, they do provide some interesting results – particularly when we have memory accesses being diverted to multiple GPUs (or even to multiple GPUs on the same PCB). The 5970 GPUs are clocked at 800/1000, with the 5870 at 1000/1250.
Dirt 3:
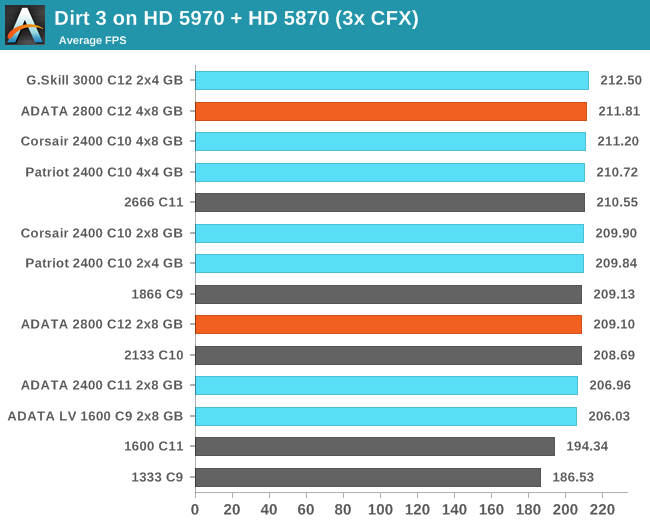
Dirt 3 Minimum FPS numbers is where we usually see the biggest gains of a high specification kit, and here the 2800 C12 goes near the top in a 4x8 GB mode. Still not enough to justify the price tag, however.
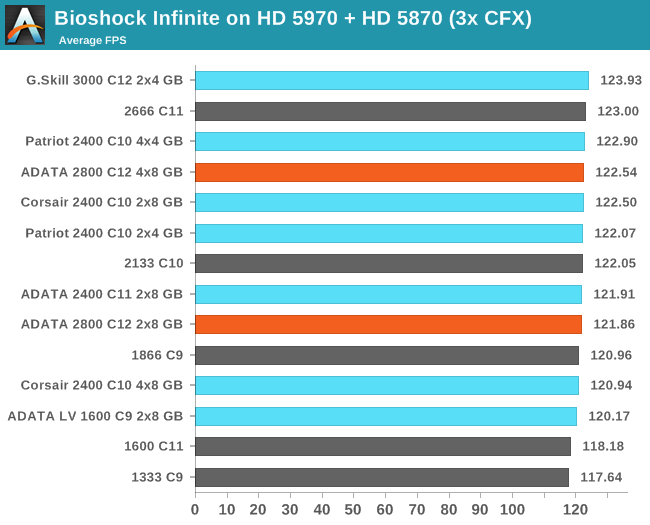
Bioshock Infinite:
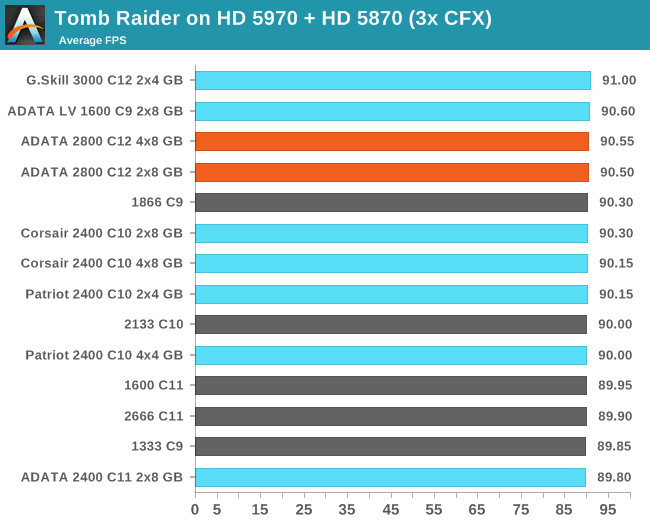
Tomb Raider:
Sleeping Dogs
CPU Real World
As mentioned previously, real world testing is where users should feel the benefits of spending more on memory. A synthetic test exacerbates a specific type of loading to get peak results in terms of memory read/write and latency timings, most of which are not indicative of the pseudo random nature of real-world workloads (opening email, applying logic). There are several situations which might fall under the typical scrutiny of a real world loading, such as video conversion/video editing. It is at this point we consider if the CPU caches are too small and the system is relying on frequent memory accesses because the CPU cannot be fed with enough data. It is these circumstances where memory speed is important, and it is all down to how the video converter is programmed rather than just a carte blanche on all video converters benefitting from memory. As we will see in the IGP Compute section of this review, anything that can leverage the IGP cores can be a ripe candidate for increased memory speed.
Our tests in the CPU Real World section come from our motherboard reviews in order to emulate potential scenarios that a user may encounter.
USB 3.0 Copy Test with MaxCPU
We transfer a set size of files from the 120GB OCZ Vertex3 connected via SATA 6 Gbps on the motherboard to the 240 GB OCZ Vertex3 SSD with a SATA 6 Gbps to USB 3.0 converter via USB 3.0 using DiskBench, which monitors the time taken to transfer. The files transferred are a 9.2 GB set of 7539 files across 1011 folders – 95% of these files are small typical website files, and the rest (90% of the size) are precompiled installers. In an update to pre-Z87 testing, we also run MaxCPU to load up one of the threads during the test which improves general performance up to 15% by causing all the internal pathways to run at full speed.
Results are represented as seconds taken to complete the copy test, where lower is better.
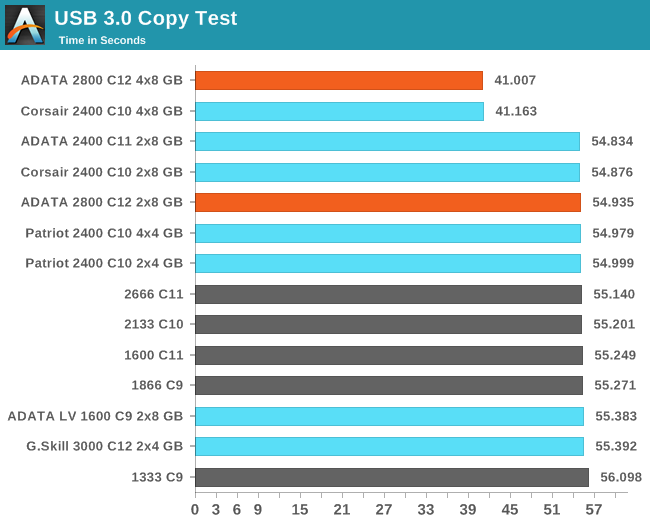
As mentioned in our Corsair 2400 C10 review, a USB data copy works significantly faster if all the data can be present in DRAM at once - for whatever reason the copy algorithm in Windows 7 uses up all the memory and then requires a refresh rather than performing bits of the copy from SSD -> DRAM asyncronously. This is why a 32GB configuration in our test outperforms any 2x8 GB or 2x4 GB configuration. Note that there is no real difference between 2x4 GB kits and 2x8 GB kits.
WinRAR 4.2
With 64-bit WinRAR, we compress the set of files used in the USB speed tests. WinRAR x64 3.93 attempts to use multithreading when possible, and provides as a good test for when a system has variable threaded load. WinRAR 4.2 does this a lot better! If a system has multiple speeds to invoke at different loading, the switching between those speeds will determine how well the system will do.
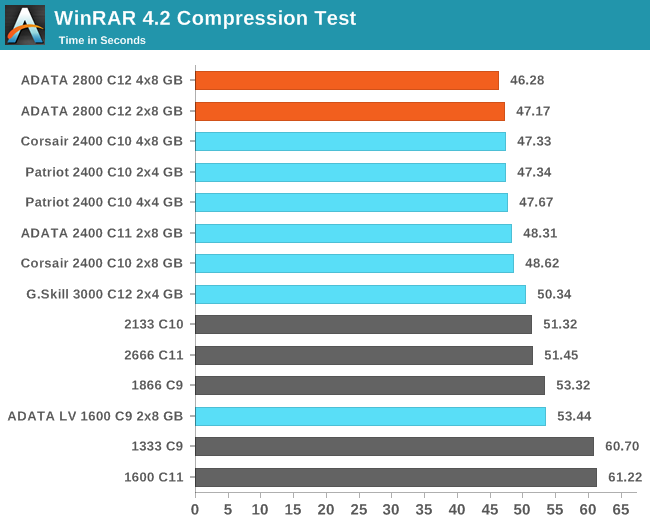
WinRAR is another benchmark that usually shows the benefit of a high end memory kit, and the ADATA gets the top results. However, for the price difference to the Corsair or Patriot kits we have tested, I doubt that the difference would be financially viable for almost everyone.
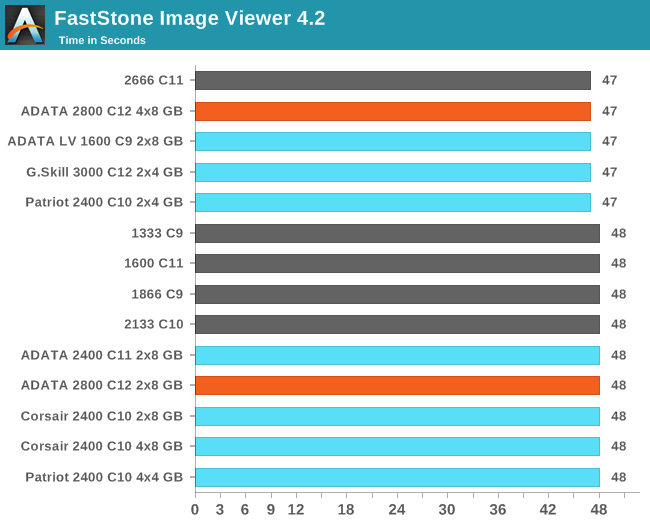
FastStone Image Viewer 4.2
FastStone Image Viewer is a free piece of software I have been using for quite a few years now. It allows quick viewing of flat images, as well as resizing, changing color depth, adding simple text or simple filters. It also has a bulk image conversion tool, which we use here. The software currently operates only in single-thread mode, which should change in later versions of the software. For this test, we convert a series of 170 files, of various resolutions, dimensions and types (of a total size of 163MB), all to the .gif format of 640x480 dimensions. Results shown are in seconds, lower is better.
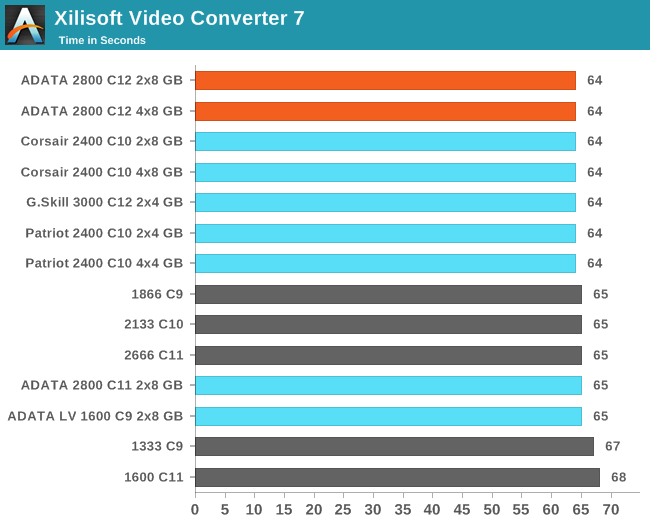
Xilisoft Video Converter 7
With XVC, users can convert any type of normal video to any compatible format for smartphones, tablets and other devices. By default, it uses all available threads on the system, and in the presence of appropriate graphics cards, can utilize CUDA for NVIDIA GPUs as well as AMD WinAPP for AMD GPUs. For this test, we use a set of 33 HD videos, each lasting 30 seconds, and convert them from 1080p to an iPod H.264 video format using just the CPU. The time taken to convert these videos gives us our result in seconds, where lower is better.
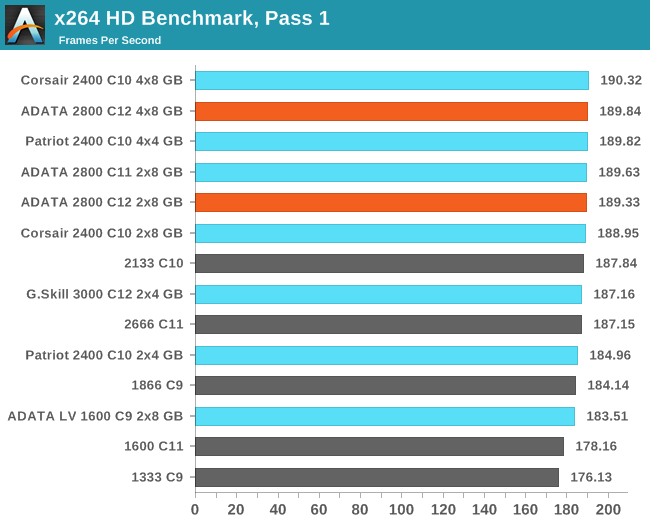
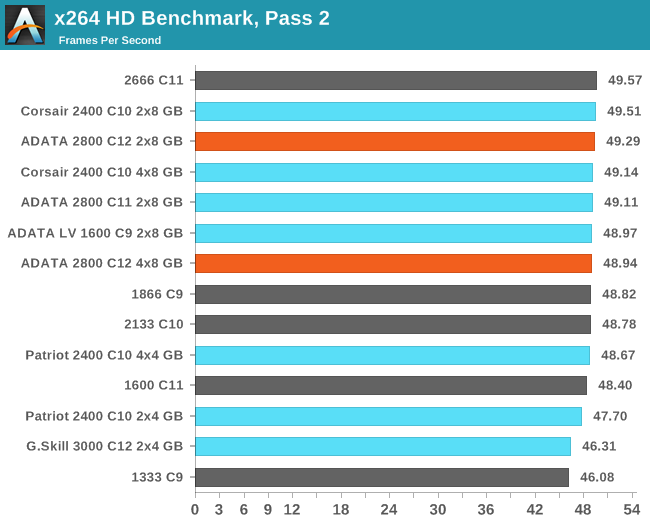
Video Conversion - x264 HD Benchmark
The x264 HD Benchmark uses a common HD encoding tool to process an HD MPEG2 source at 1280x720 at 3963 Kbps. This test represents a standardized result which can be compared across other reviews, and is dependent on both CPU power and memory speed. The benchmark performs a 2-pass encode, and the results shown are the average frame rate of each pass performed four times. Higher is better this time around.
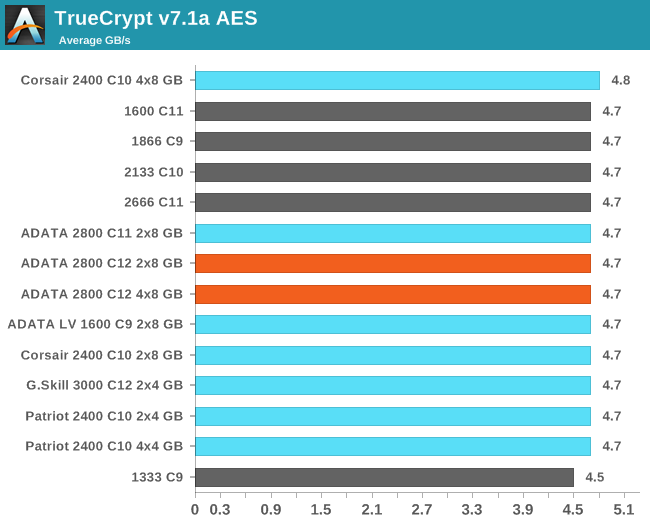
TrueCrypt v7.1a AES
One of Anand’s common CPU benchmarks is TrueCrypt, a tool designed to encrypt data on a hard-drive using a variety of algorithms. We take the program and run the benchmark mode using the fastest AES encryption protocol over a 1GB slice, calculating the speed in GB/s. Higher is better.
CPU Compute
One side I like to exploit on CPUs is the ability to compute and whether a variety of mathematical loads can stress the system in a way that real-world usage might not. For these benchmarks we are ones developed for testing MP servers and workstation systems back in early 2013, such as grid solvers and Brownian motion code. Please head over to the first of such reviews where the mathematics and small snippets of code are available.
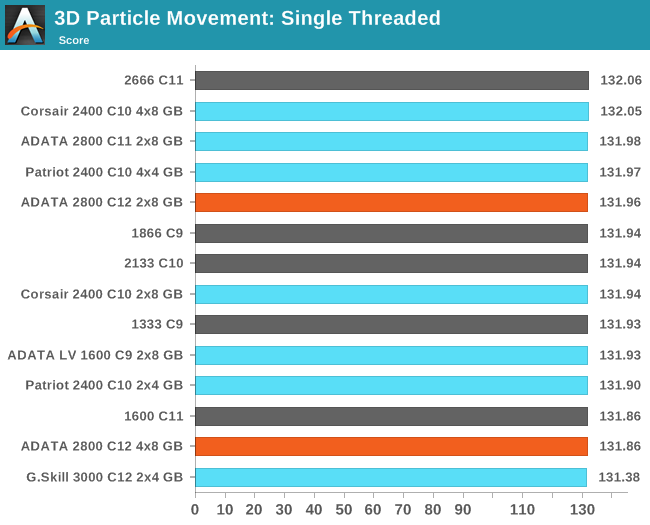
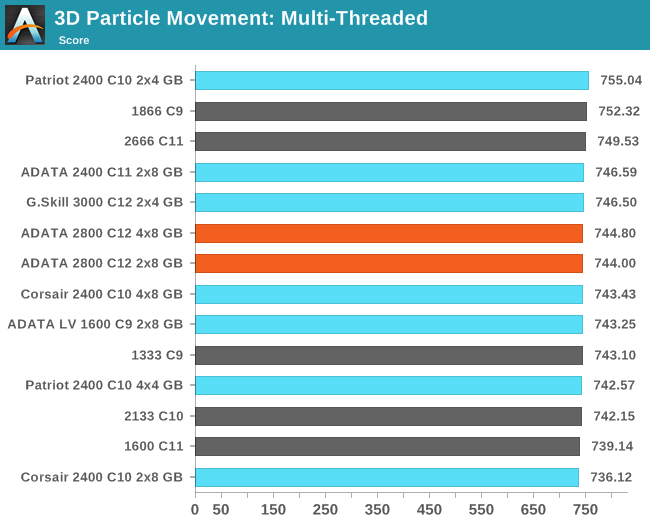
3D Movement Algorithm Test
The algorithms in 3DPM employ uniform random number generation or normal distribution random number generation, and vary in various amounts of trigonometric operations, conditional statements, generation and rejection, fused operations, etc. The benchmark runs through six algorithms for a specified number of particles and steps, and calculates the speed of each algorithm, then sums them all for a final score. This is an example of a real world situation that a computational scientist may find themselves in, rather than a pure synthetic benchmark. The benchmark is also parallel between particles simulated, and we test the single thread performance as well as the multi-threaded performance. Results are expressed in millions of particles moved per second, and a higher number is better.
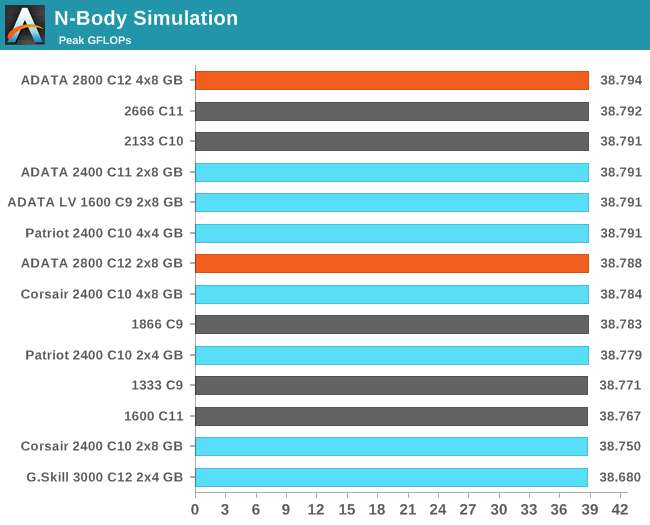
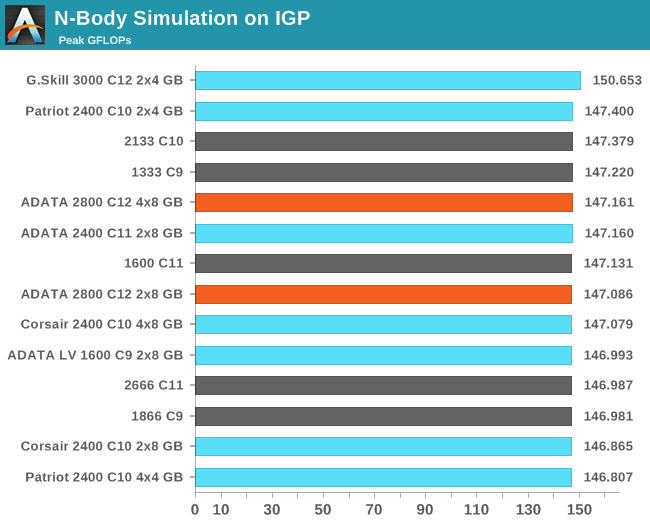
N-Body Simulation
When a series of heavy mass elements are in space, they interact with each other through the force of gravity. Thus when a star cluster forms, the interaction of every large mass with every other large mass defines the speed at which these elements approach each other. When dealing with millions and billions of stars on such a large scale, the movement of each of these stars can be simulated through the physical theorems that describe the interactions. The benchmark detects whether the processor is SSE2 or SSE4 capable, and implements the relative code. We run a simulation of 10240 particles of equal mass - the output for this code is in terms of GFLOPs, and the result recorded was the peak GFLOPs value.
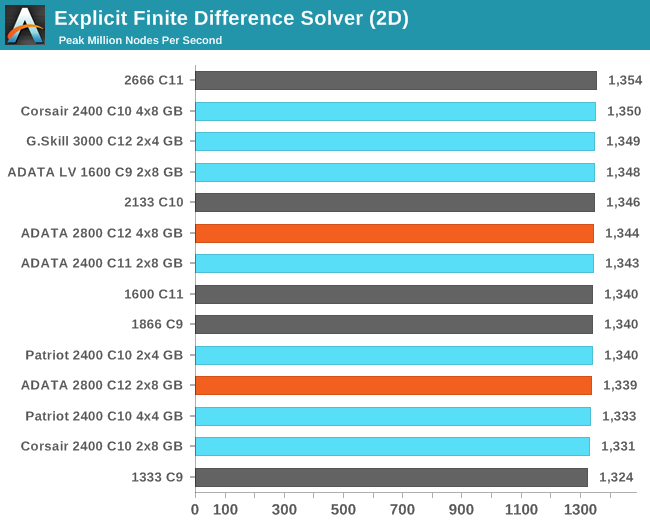
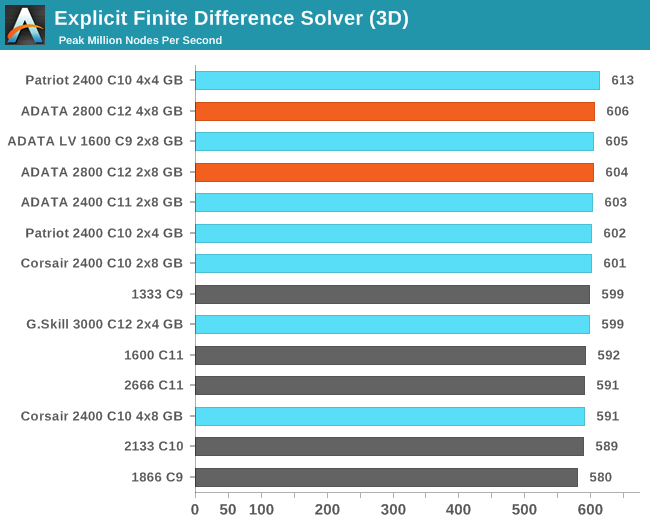
Grid Solvers - Explicit Finite Difference
For any grid of regular nodes, the simplest way to calculate the next time step is to use the values of those around it. This makes for easy mathematics and parallel simulation, as each node calculated is only dependent on the previous time step, not the nodes around it on the current calculated time step. By choosing a regular grid, we reduce the levels of memory access required for irregular grids. We test both 2D and 3D explicit finite difference simulations with 2n nodes in each dimension, using OpenMP as the threading operator in single precision. The grid is isotropic and the boundary conditions are sinks. We iterate through a series of grid sizes, and results are shown in terms of ‘million nodes per second’ where the peak value is given in the results – higher is better.
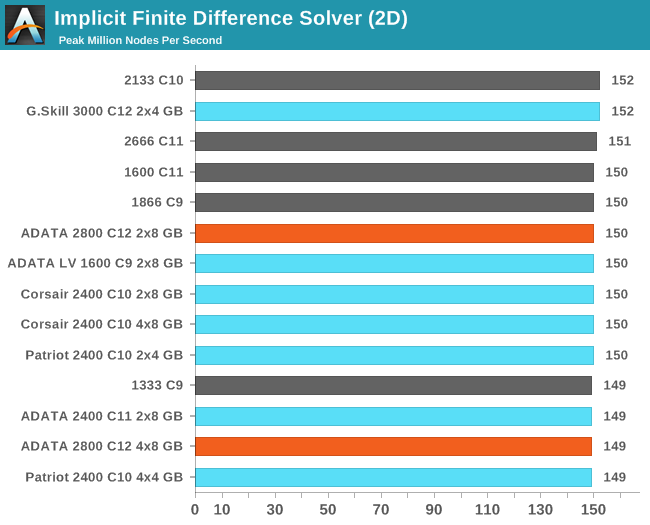
Grid Solvers - Implicit Finite Difference + Alternating Direction Implicit Method
The implicit method takes a different approach to the explicit method – instead of considering one unknown in the new time step to be calculated from known elements in the previous time step, we consider that an old point can influence several new points by way of simultaneous equations. This adds to the complexity of the simulation – the grid of nodes is solved as a series of rows and columns rather than points, reducing the parallel nature of the simulation by a dimension and drastically increasing the memory requirements of each thread. The upside, as noted above, is the less stringent stability rules related to time steps and grid spacing. For this we simulate a 2D grid of 2n nodes in each dimension, using OpenMP in single precision. Again our grid is isotropic with the boundaries acting as sinks. We iterate through a series of grid sizes, and results are shown in terms of ‘million nodes per second’ where the peak value is given in the results – higher is better.
IGP Compute
One of the touted benefits of Haswell is the compute capability afforded by the IGP. For anyone using DirectCompute or C++ AMP, the compute units of the HD 4600 can be exploited as easily as any discrete GPU, although efficiency might come into question. Shown in some of the benchmarks below, it is faster for some of our computational software to run on the IGP than the CPU (particularly the highly multithreaded scenarios).
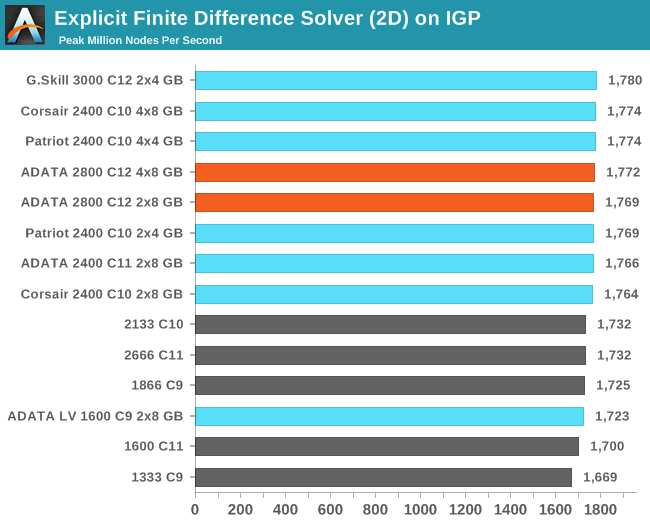
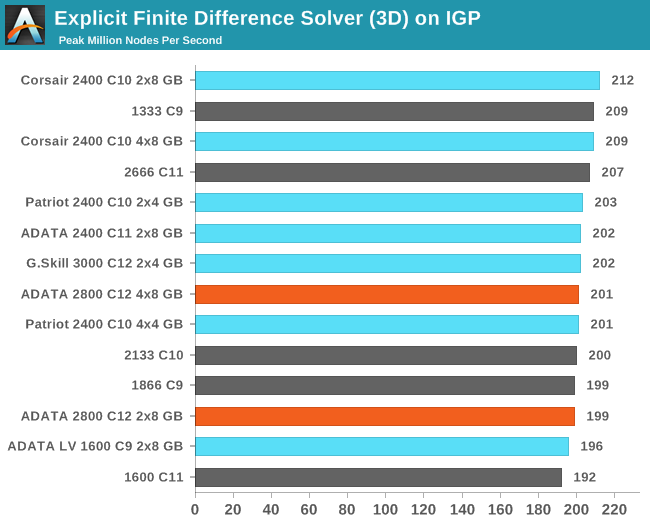
Grid Solvers - Explicit Finite Difference on IGP
As before, we test both 2D and 3D explicit finite difference simulations with 2n nodes in each dimension, using OpenMP as the threading operator in single precision. The grid is isotropic and the boundary conditions are sinks. We iterate through a series of grid sizes, and results are shown in terms of ‘million nodes per second’ where the peak value is given in the results – higher is better.
N-Body Simulation on IGP
As with the CPU compute, we run a simulation of 10240 particles of equal mass - the output for this code is in terms of GFLOPs, and the result recorded was the peak GFLOPs value.
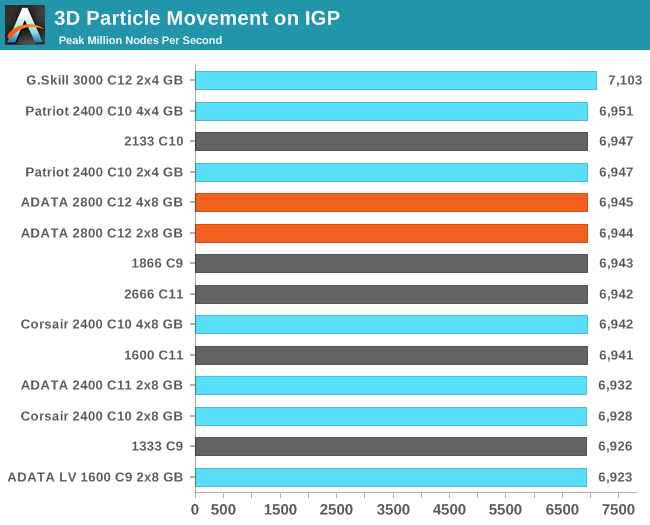
3D Particle Movement on IGP
Similar to our CPU Compute algorithm, we calculate the random motion in 3D of free particles involving random number generation and trigonometric functions. For this application we take the fastest true-3D motion algorithm and test a variety of particle densities to find the peak movement speed. Results are given in ‘million particle movements calculated per second’, and a higher number is better.
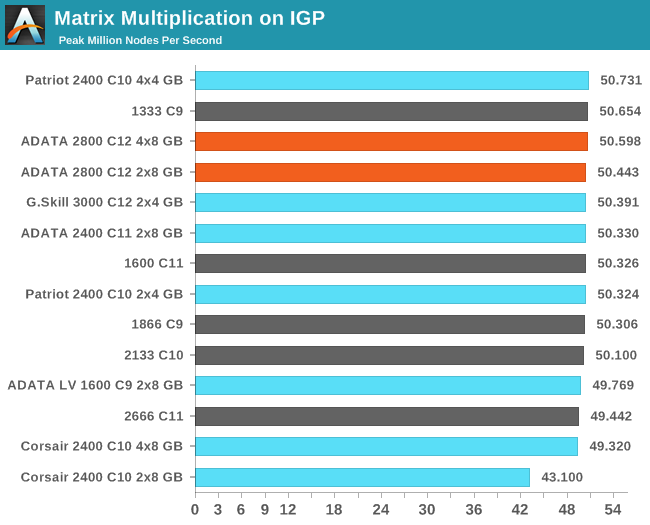
Matrix Multiplication on IGP
Matrix Multiplication occurs in a number of mathematical models, and is typically designed to avoid memory accesses where possible and optimize for a number of reads and writes depending on the registers available to each thread or batch of dispatched threads. He we have a crude MatMul implementation, and iterate through a variety of matrix sizes to find the peak speed. Results are given in terms of ‘million nodes per second’ and a higher number is better.
Overclocking Results
When it comes to memory overclocking, there are several ways to approach the issue. Typically memory overclocking is rarely required - only those attempting to run benchmarks need worry about pushing the memory to its uppermost limits. It also depends highly on the memory kits being used - memory is similar to processors in the fact that the ICs are binned to a rated speed. The higher the bin, the better the speed - however if there is a demand for lower speed memory, then the higher bin parts may be declocked to increase supply of the lower clocked component. Similarly, for the high end frequency kits, less than 1% of all ICs tested may actually hit the speed of the kit, hence the price for these kits increase exponentially.
With this in mind, there are several ways a user can approach overclocking memory. The art of overclocking memory can be as complex or as simple as the user would like - typically the dark side of memory overclocking requires deep in-depth knowledge of how memory works at a fundamental level. For the purposes of this review, we are taking overclocking in three different scenarios:
a) From XMP, adjust Command Rate from 2T to 1T
b) From XMP, increase Memory Speed strap (e.g. 1333 MHz -> 1400 -> 1600)
c) From XMP, test a range of sub-timings (e.g. 10-12-12 to 13-15-15 to 8-10-10) and find the best MHz theses are rated.
There is plenty of scope to overclock beyond this, such as adjusting voltages or the voltage of the memory controller – for the purposes of this test we raise the memory voltage to the ‘next stage’ above its rated voltage (1.35V to 1.5V, 1.5V to 1.65V, 1.65V to 1.72V). As long as a user is confident with adjusting these settings, then there is a good chance that the results here will be surpassed. There is also the fact that individual sticks of memory may perform better than the rest of the kit, or that one of the modules could be a complete dud and hold the rest of the kit back. For the purpose of this review we are seeing if the memory out of the box, and the performance of the kit as a whole, will work faster at the rated voltage.
In order to ensure that the kit is stable at the new speed, we run the Linpack test within OCCT for five minutes as well as the PovRay benchmark. This is a small but thorough test, and we understand that users may wish to stability test for longer to reassure themselves of a longer element of stability. However for the purposes of throughput, a five minute test will catch immediate errors from the overclocking of the memory.
With this in mind, the kit performed as follows:
| Test | PovRay | CPU OCCT |
| XMP | 1612.21 | 78C |
|---|---|---|
| XMP, 2T to 1T | No POST | No POST |
| 2933 12-14-14 | 1592.07 | 80C |
| 3000 12-14-14 | No POST | No POST |
| Subtimings | Peak MHz | PovRay | CPU OCCT | Final PI |
| 7-9-9 | 1666 | 1615.93 | 76C | 238 |
|---|---|---|---|---|
| 8-10-10 | 1866 | 1610.20 | 77C | 233 |
| 9-11-11 | 2200 | 1609.75 | 77C | 244 |
| 10-12-12 | 2400 | 1596.13 | 78C | 240 |
| 11-13-13 | 2666 | 1612.68 | 78C | 242 |
| 12-14-14 | 2933 | 1612.20 | 78C | 244 |
| 13-15-15 | 2933 | 1610.81 | 78C | 226 |
With our overclocking of previous memory kits showing a rough 10% increase in PI from stock, moving from 233 to 240-245 is not that much of a jump. When moving to higher than 2800 though, the base line PI is often fixed therein due to the high IC bin to begin with. While we have tested kits that achieve a PI of 267, they were for a limited range (up to 2400 MHz).
Conclusions
The problem these high MHz specification kits have is like a see-saw. If it had the real-world performance in line with price increments for memory, it would justify itself in the cost – but instead we get an inflated price for no real world benefit. This is endemic to any DRAM manufacturer who bids on these high end Hynix ICs just to provide themselves with promotion material to say ‘we sell high MHz DDR3’. Ultimately the only benchmarks that show any benefit are synthetic tests, and any real world test that benefits from high end memory tends to reach limiting returns around DDR3-2400 C10. Only specific memory limited compute tasks benefit from the high end numbers. Even in Dirt 3 minimum frame rates, where we usually see the biggest difference in memory timings, the results are obvious:
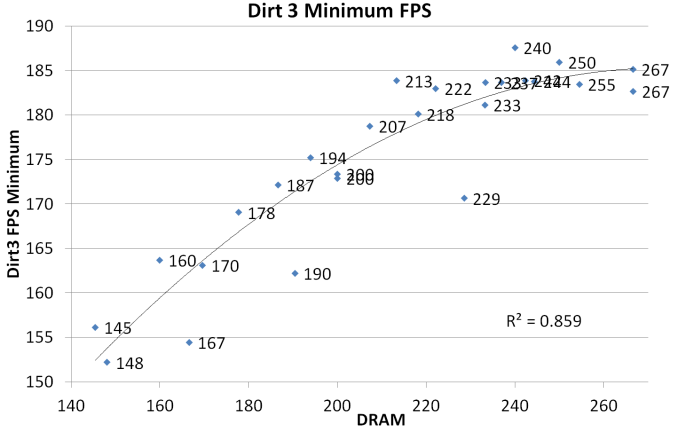
In this graph the x-axis is the Performance Index of the DRAM, and thus a PI of 200 can be 1600 C8 or 2400 C12.
Back in our pricing analysis, we saw a big jump moving from 2666 MHz to 2800 MHz memory:
$205: G.Skill TridentX 2x8 GB 2666 C12
$230: Team Xtreem 2x8 GB 2666 C11
$270: G.Skill TridentX 2x8GB 2666 C11
$320: Corsair Dominator Platinum 2x8GB 2666 C11
$320: Corsair Dominator Platinum 2x8GB 2666 C12
$600: G.Skill TridentX 2x8GB 2800 C12
$646: ADATA XPG V2 2x8GB 2800 C12
$730: Corsair Vengeance Pro 2x8GB 2800 C12
$750: G.Skill TridentX 2x8GB 2933 C12
At C11/C12, these memory kits perform roughly the same, meaning that the +100% price difference ($320 -> $646) is essentially another midrange GPU (or half a GTX 780 Ti) worth of cost. For that reason alone, no DDR3-2800+ kit is ever going to be justified in cost.
I cannot fault ADATA on their product – DDR3-2800 C12 is as DDR3-2800 C12 does. It overclocks a relatively small amount, and it pairs high specifications with high density and thus high price for little performance gain in our testing suite. My conclusion is essentially the same as with the G.Skill DDR3-3000 C12 2x4GB kit we tested (which was around the same price as this 2x8GB kit):
“It is a high price for a kit that offers little apart from a number parade. Perhaps the thing to remember is that plenty of memory manufacturers are also aiming at high MHz – Corsair, Avexir, TeamGroup, Apacer and others. If I had that money to spend on a daily Haswell system, I might plump for 4x8GB of DDR3-2400 C10 and upgrade the GPU with money left over.”


